Recommended by Manish Jaradi
Building Confidence in Trading
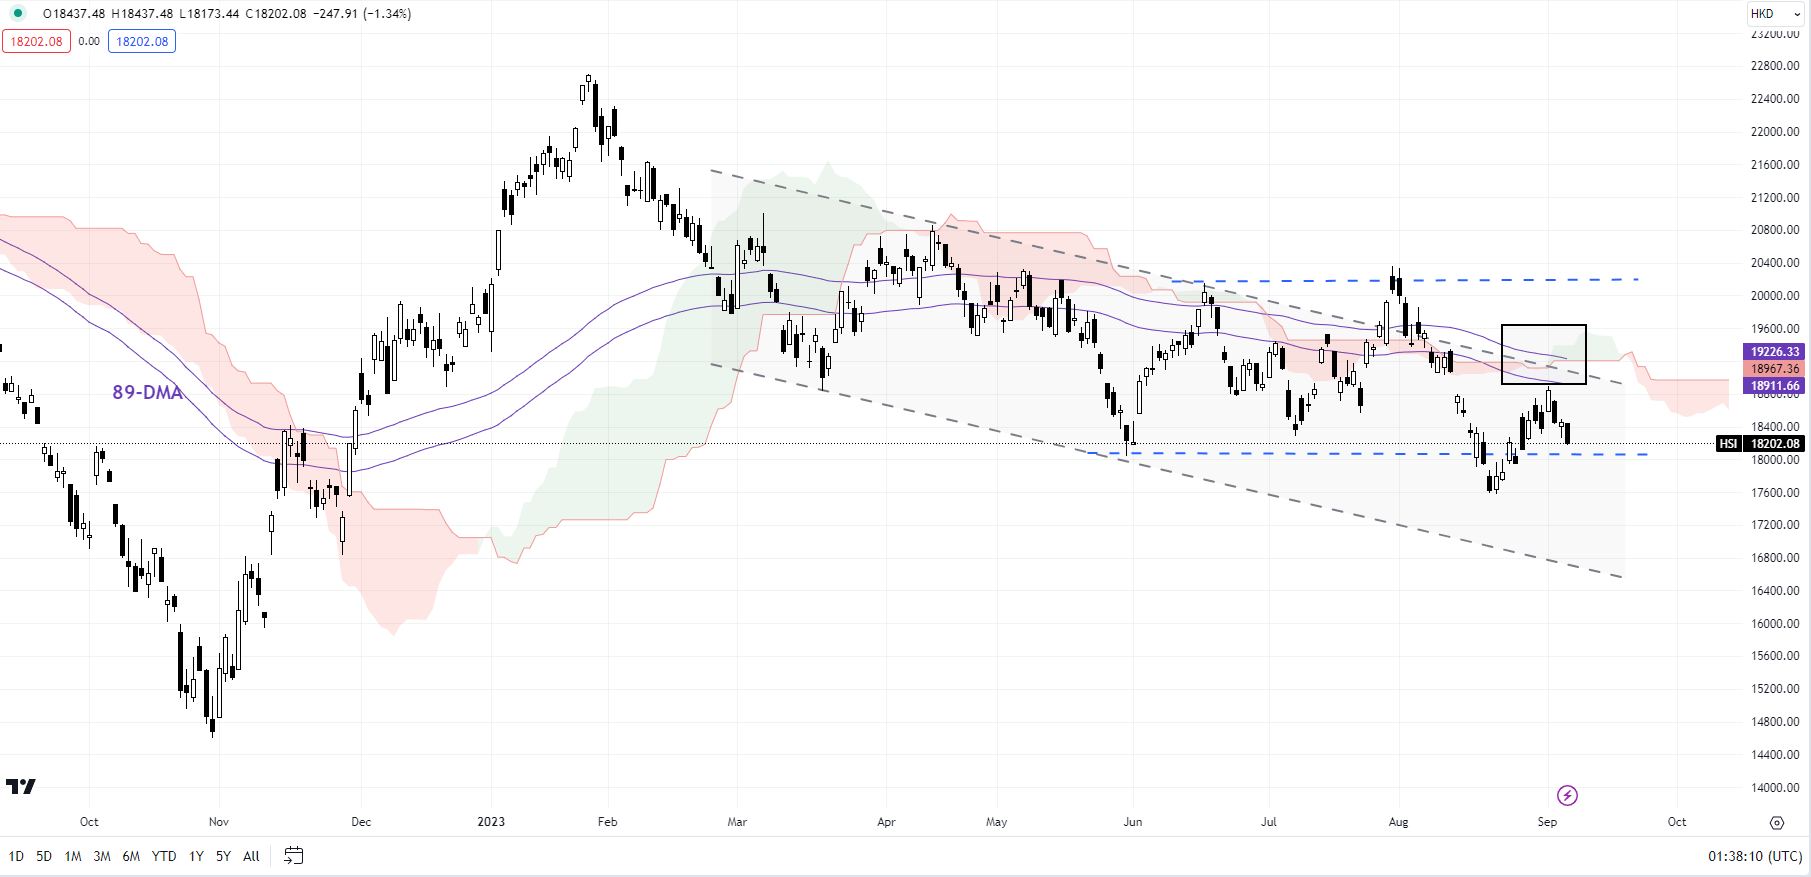
The failure of the Hang Seng Index to clear a crucial barrier on the 89-day moving average, the upper edge of a declining channel since early 2023, and the Ichimoku cloud on the daily charts (at about 18900-19200) suggests the recent rally is nothing more than corrective. This follows a rebound from near a tough floor at the June low of 18045.
Chart Created Using TradingView
A decisive break above would raise the chances that the Hong Kong benchmark index was finally beginning to flex muscles after underperforming since early 2023. Indeed, such a break would heighten the chances of the index clearing the few-times tested resistance at 20155. On the downside, a failure to hold above last month’s low of 17575 could open the way initially toward the November 2022 low of 16830.
Chart Created Using TradingView
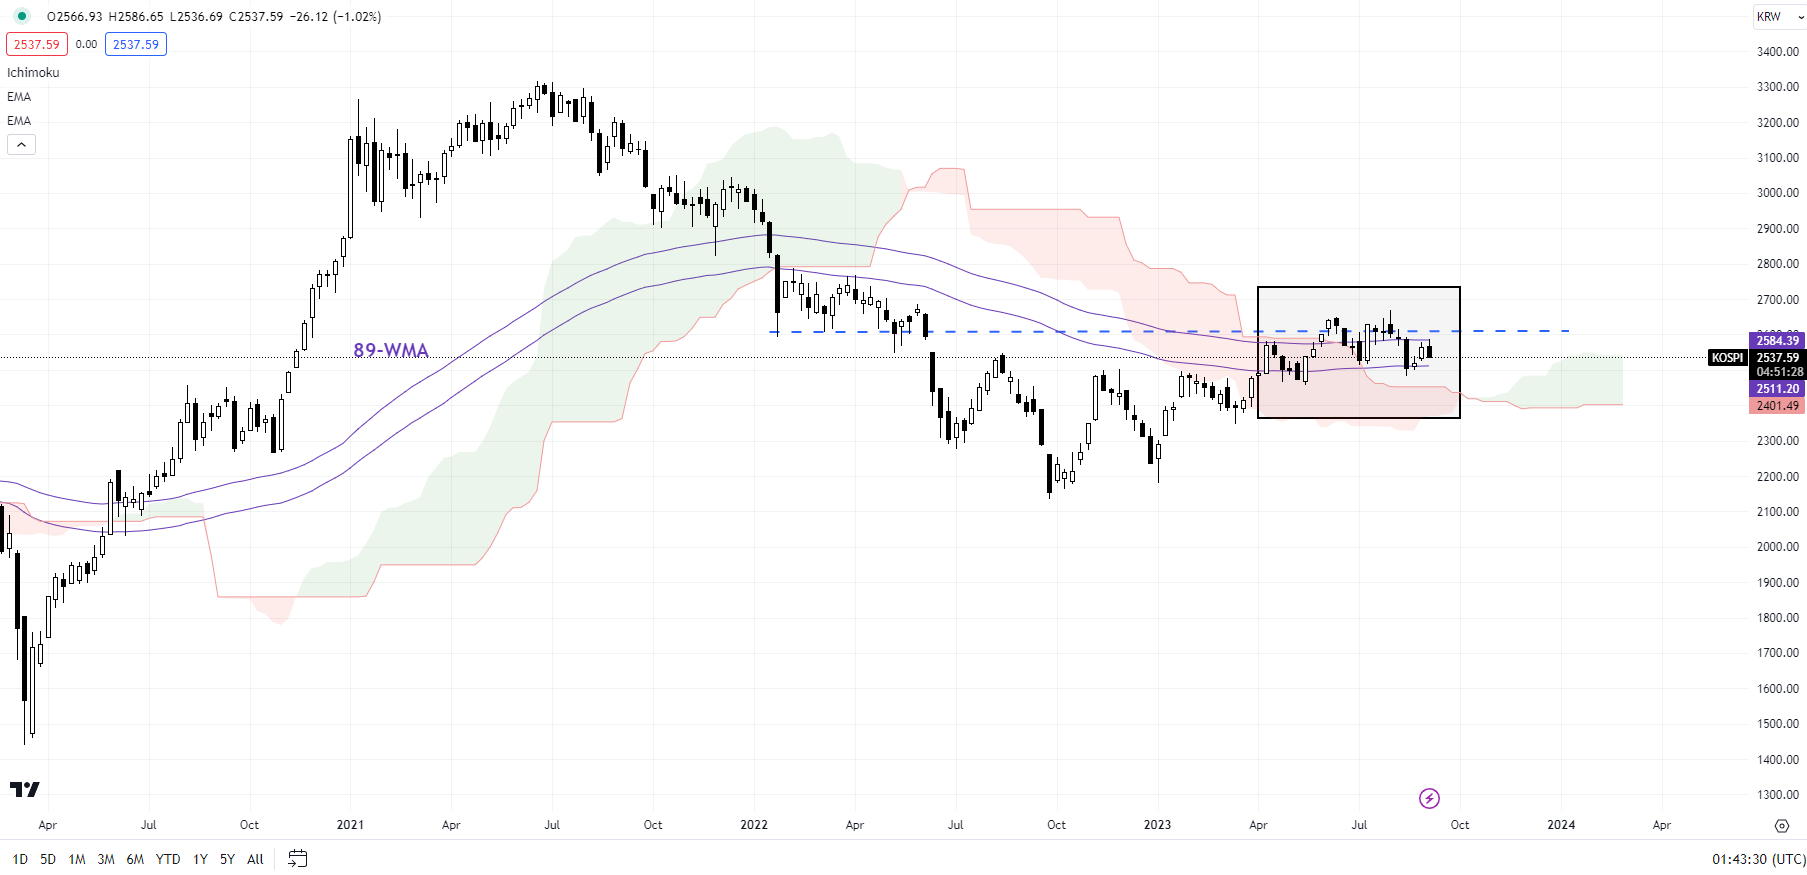
A double top at major resistance and a lower low created in August raises the odds that Kospi’s rally this year could be reversing. A break below the crucial support at the July low of 2515 has triggered a minor double top (the June and August highs), potentially opening the door toward 2380. Stronger support is at the March low of 2350 – Kospi needs to hold above this support for the rebound from late last year to resume. The index has faced stiff converged resistance on the 89-week moving average, a horizontal trendline since 2022, around the upper edge of the Ichimoku cloud on the weekly charts.
Chart Created Using TradingView
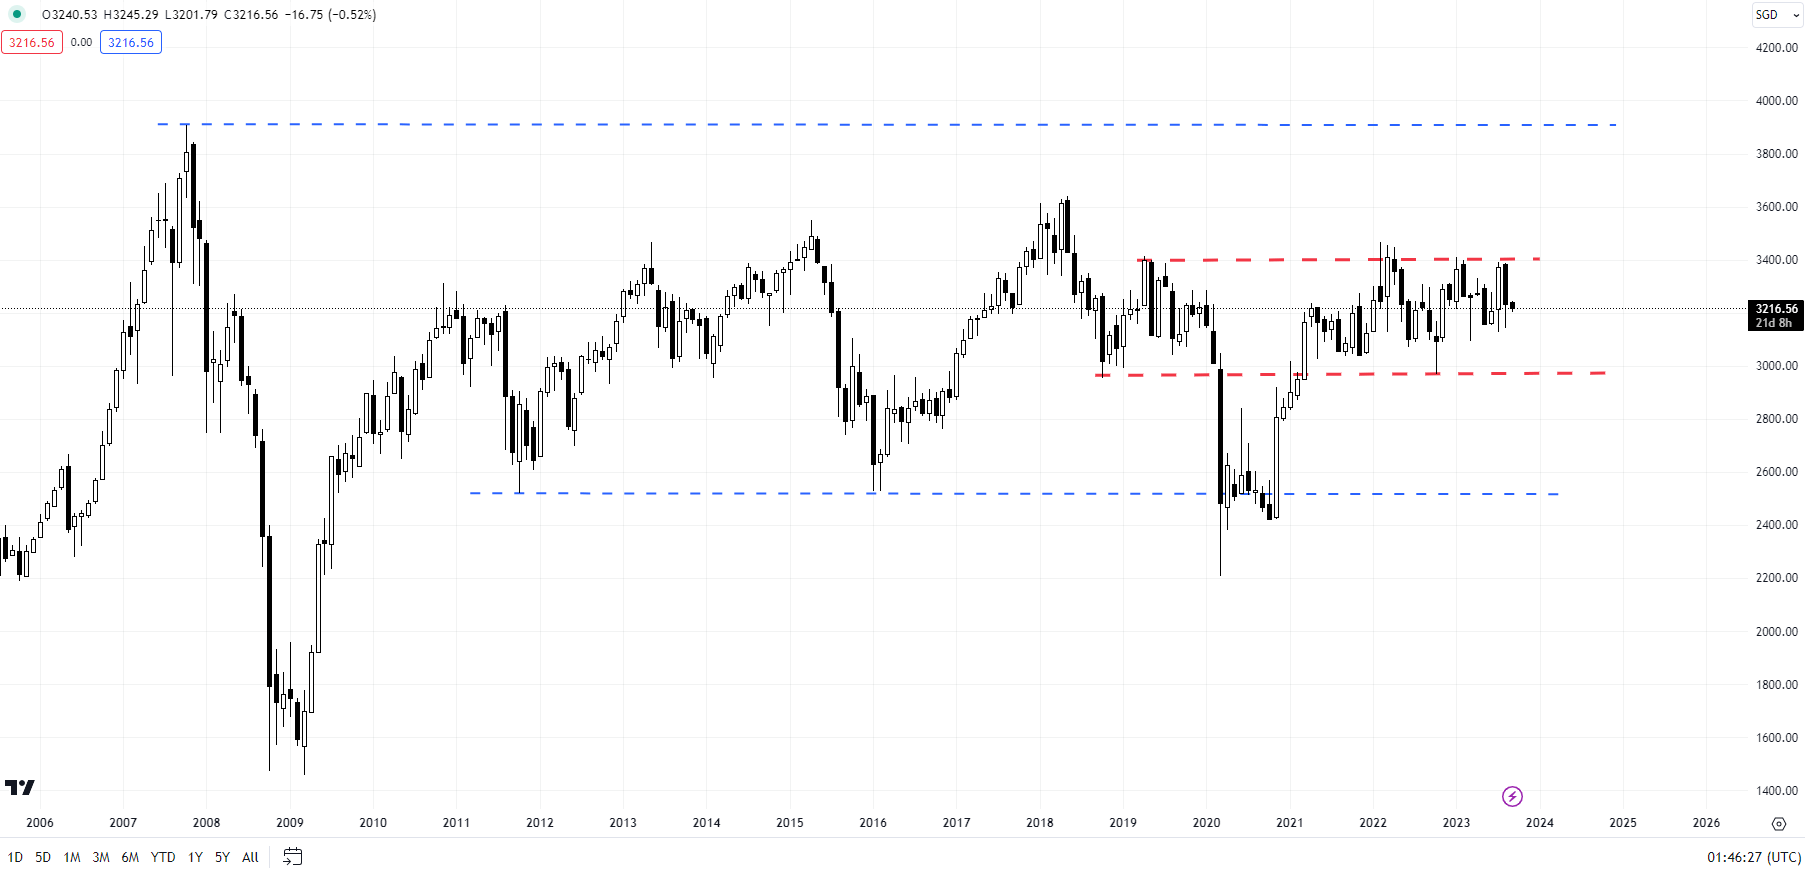
Singapore’s FTSE Straits Times Index continues to trend within a narrow range of 3000-3400. Barring the brief low of 2968 created in Q4-2022, the index appears to have set a solid low around 2950-3050, which includes the 200-week moving average. As mentioned in the previous update, a break below is by no means imminent – it could well rebound as it has done multiple times since 2021. See “Asian Indices Feel the Heat of Rising Yields: Hang Seng, Kospi, Straits Times Index Setups,” published August 22.
However, any break below could raise the odds that the post-Covid rebound is over, putting the index back within a very broad range of 2200-3500 (including the 2020 low and the 2022 high). For the bullishness to resume, a crack above resistance at the 2022 high would be needed. Until then, the path of least resistance remains sideways to down.
--- Written by Manish Jaradi, Strategist for DailyFX.com
--- Contact and follow Jaradi on Twitter: @JaradiManish
 |
"Simply a Must Read for Every Serious Forex Beginner" Available at Amazon Now also for Kindle
|