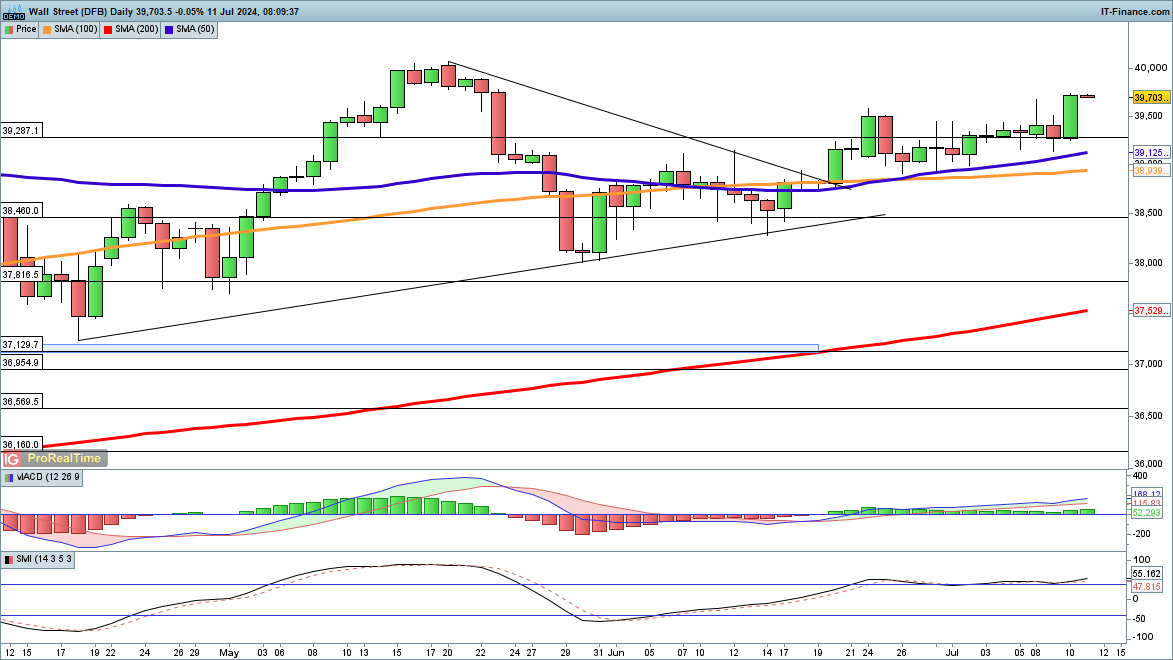
?The index has finally made strong gains, rallying to a seven-week high, though it remains below the May record highs, in contrast to the S&P 500 and Nasdaq 100. ?Further gains target that May high, at 40,080. For the moment, higher intraday lows continue to indicate bullish momentum, and the short-term view remains bullish so long as the price holds above the 50-day simple moving average (SMA), currently 39,125.
?A close back below 39,000 would negate the short-term bullish view and potentially open the way to the 38,500 and then 38,000 levels.
Dow Jones Daily Chart
of clients arenet long. of clients arenet short.| Change in | Longs | Shorts | OI |
| Daily | -17% | 9% | 0% |
| Weekly | -18% | 14% | 3% |
?
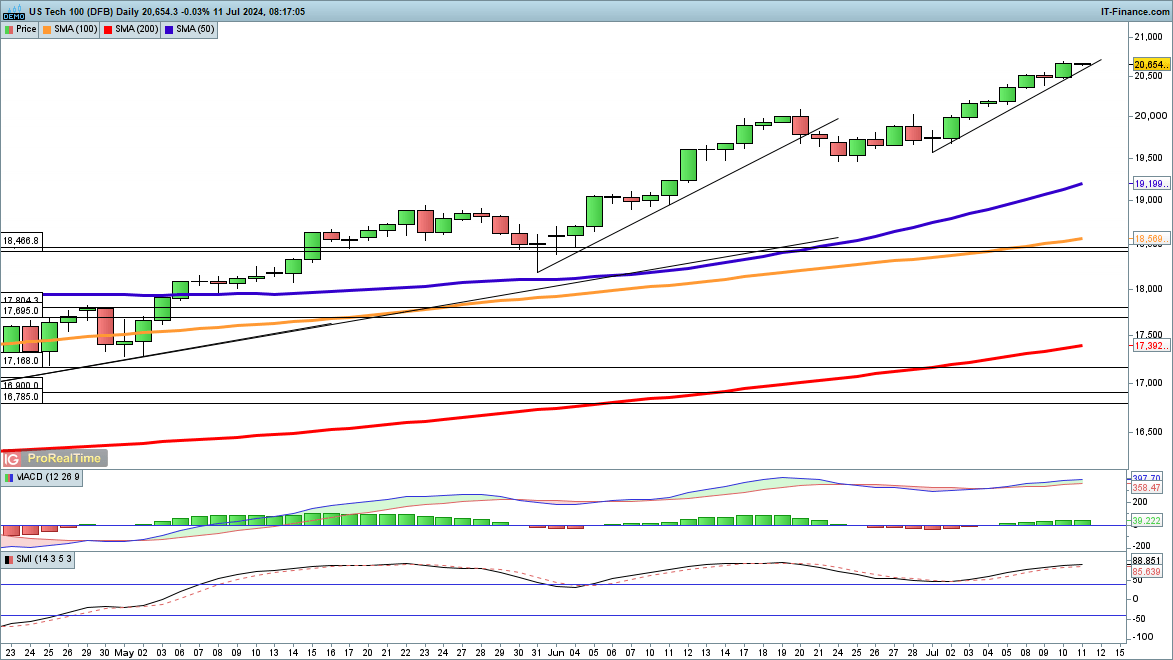
?Another day, another record high for the index, with no sign of any pre-CPI nervousness. ?Trendline support from the 1 July low continues to underpin in the short-term, but a close back below 20,500 might indicate that a high has been reached for the time being.
?There is, as yet, little sign of any more substantial pullback beginning to emerge.
Nasdaq 100 Daily Chart
?
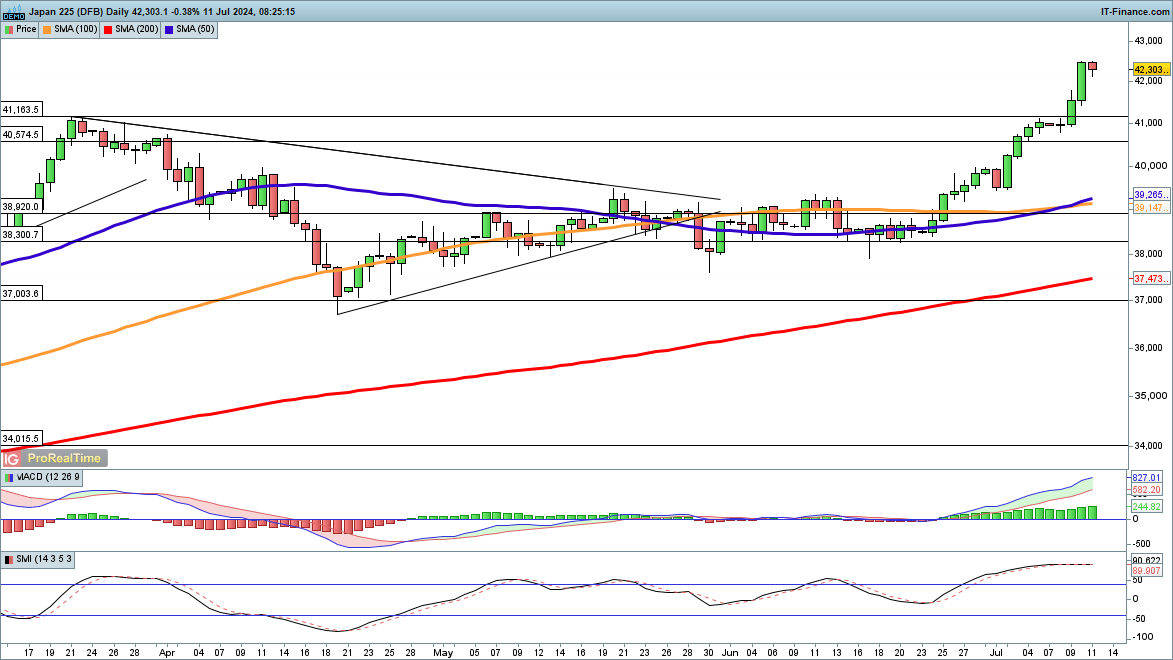
?The index has added around 12% in the space of less than a month, climbing through 42,000 for the first time in its history.?Short-term consolidation may lie ahead, though the overall bullish view remains firmly in place. A short-term pullback may head towards 41,163, the previous record high.
Nikkei 225 Daily Chart
 |
"Simply a Must Read for Every Serious Forex Beginner" Available at Amazon Now also for Kindle
|