Recommended by Daniel Dubrovsky
Get Your Free GBP Forecast
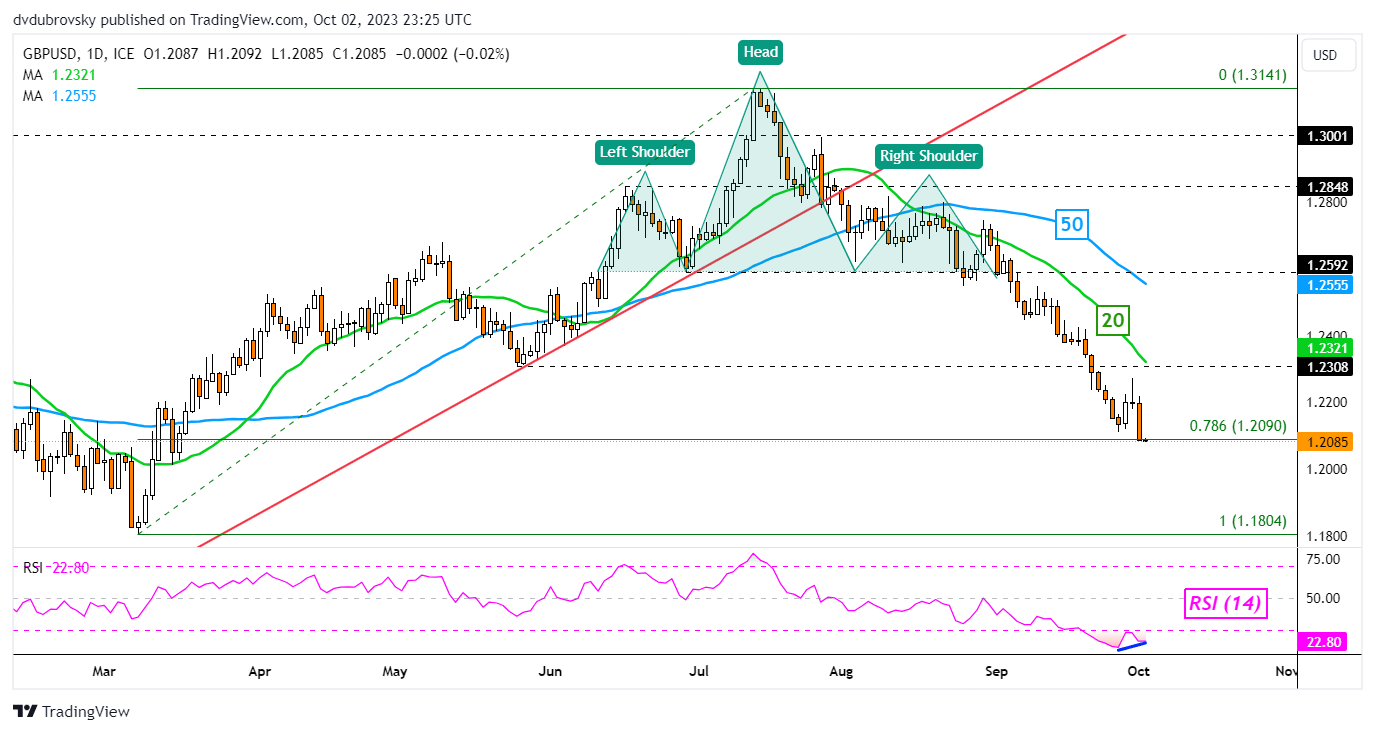
The British Pound appears to be increasingly vulnerable against the US Dollar and Japanese Yen from a technical perspective. On the daily chart below, GBP/USD has continued making downside progress in the aftermath of a bearish Head & Shoulders chart formation. Now, recent losses have brought the exchange rate to the 78.6% Fibonacci retracement level of 1.209.
There is a positive RSI divergence, which shows that downside momentum is fading. That can at times precede a turn lower. But, the 20- and 50-day moving averages remain sloping lower. These may hold as resistance, maintaining the broader downside focus. Further losses place the focus on the March low of 1.1804.
GBP/USD – Daily Chart
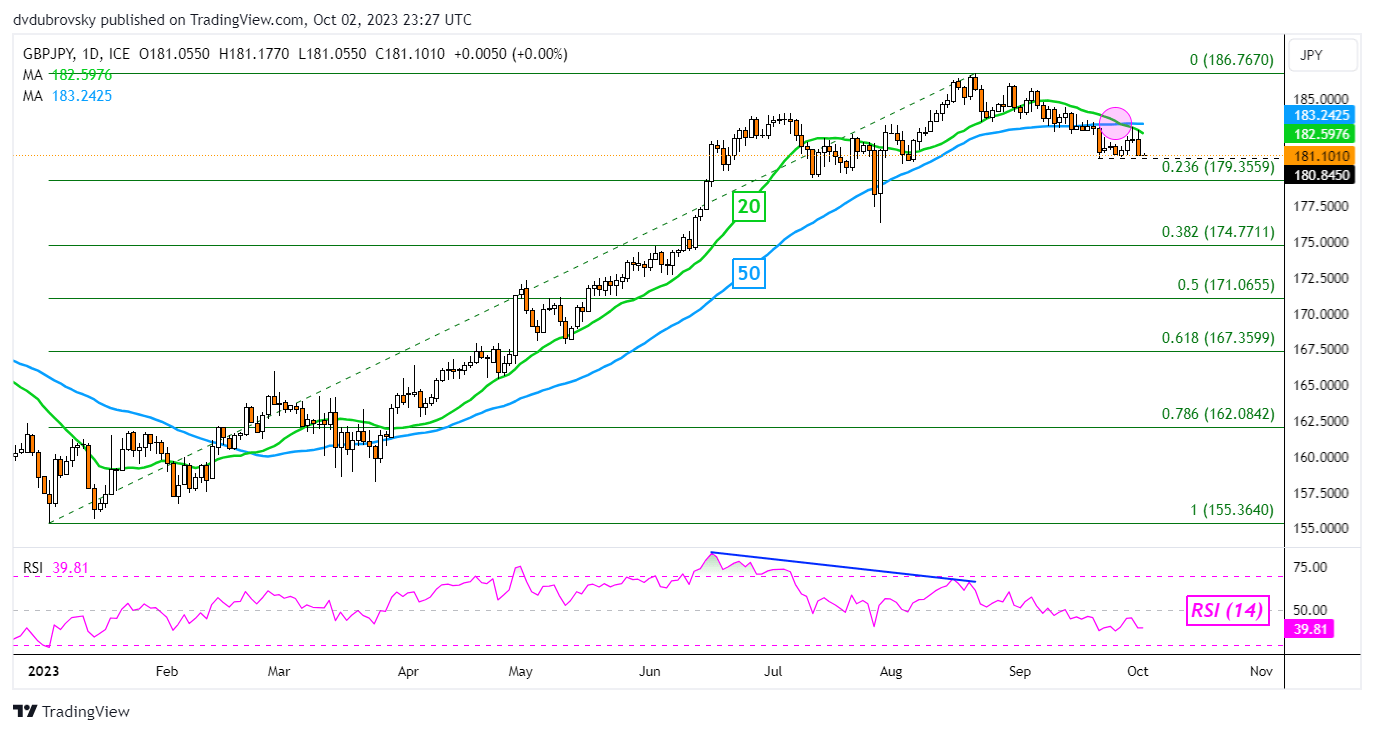
The Japanese Yen has been slightly more resilient to the British Pound compared to the US Dollar. GBP/JPY remains idling above the 180.84 support point that has been holding up since September. But, a Bearish Death Cross recently formed between the 20- and 50-day moving averages. This could spell further trouble for the exchange rate.
A breakout lower offers a stronger bearish technical bias, exposing the 23.6% Fibonacci retracement level at 179.35. Below that is the 38.2% point of 174.77. Meanwhile, immediate resistance are the near-term moving averages. Breaking above would offer a neutral bias, placing the focus on the August peak of 186.76.
of clients arenet long. of clients arenet short. Change in Longs Shorts OI Daily 14% 8% 10% Weekly -11% -7% -8%GBP/JPY – Daily Chart
--- Written by Daniel Dubrovsky, Senior Strategist for DailyFX.com
 |
"Simply a Must Read for Every Serious Forex Beginner" Available at Amazon Now also for Kindle
|