Recommended by Daniel Dubrovsky
Get Your Free Gold Forecast
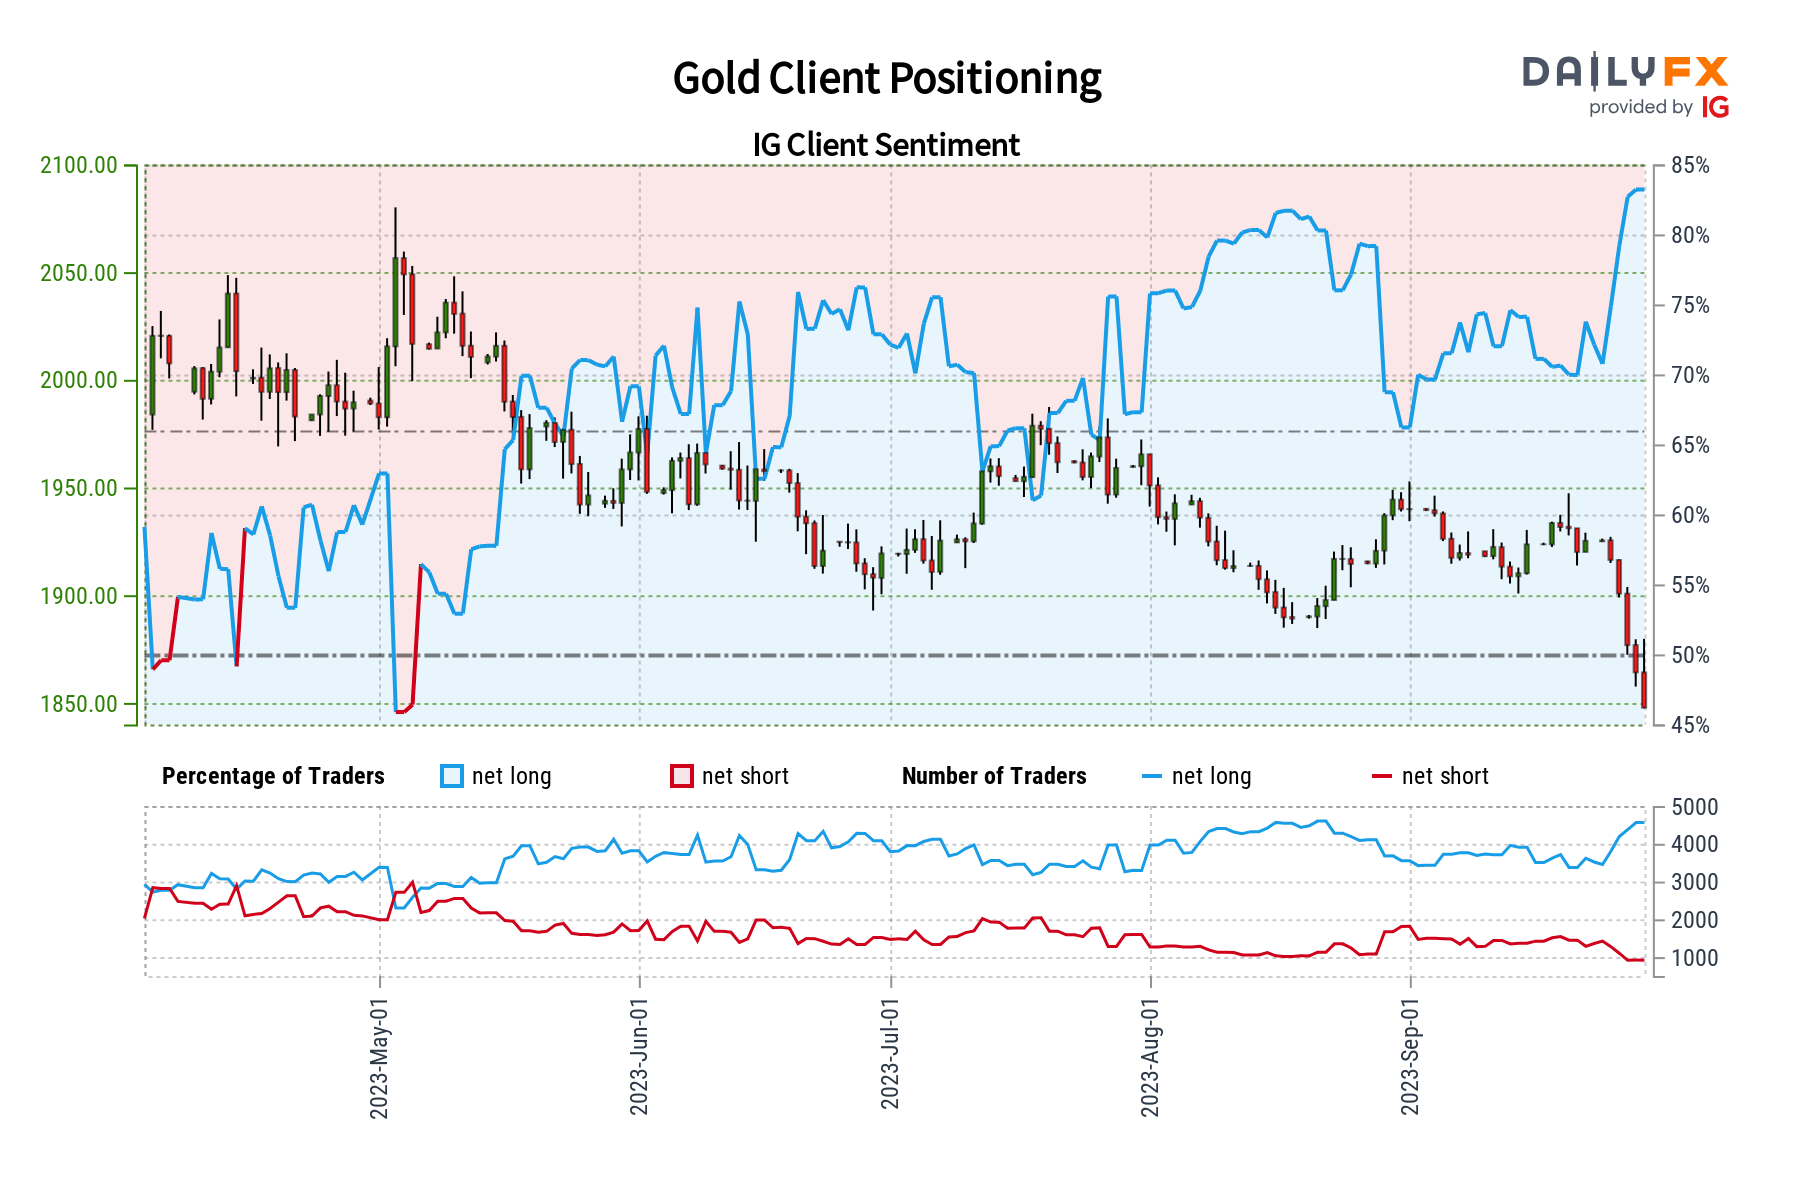
Gold prices sank about 4 percent last week. To give some context, we have not seen this kind of performance since June 2021. Meanwhile, retail traders continue to increase their upside exposure in XAU/USD. This can be seen by looking at IG Client Sentiment (IGCS), which frequently worked as a contrarian indicator. As such, things may not be looking too good for gold as the new week begins.
The IGCS gauge shows that a strong majority of 85% of retail traders are net-long XAU/USD. Since they are overwhelmingly biased to the upside, this continues to hint that prices may fall down the road. This is as upside exposure increased by 4.9% from last Thursday through Friday and 34% compared to one week ago from last Friday. With that in mind, the combination of overall exposure and recent changes produces a stronger bearish contrarian trading bias.
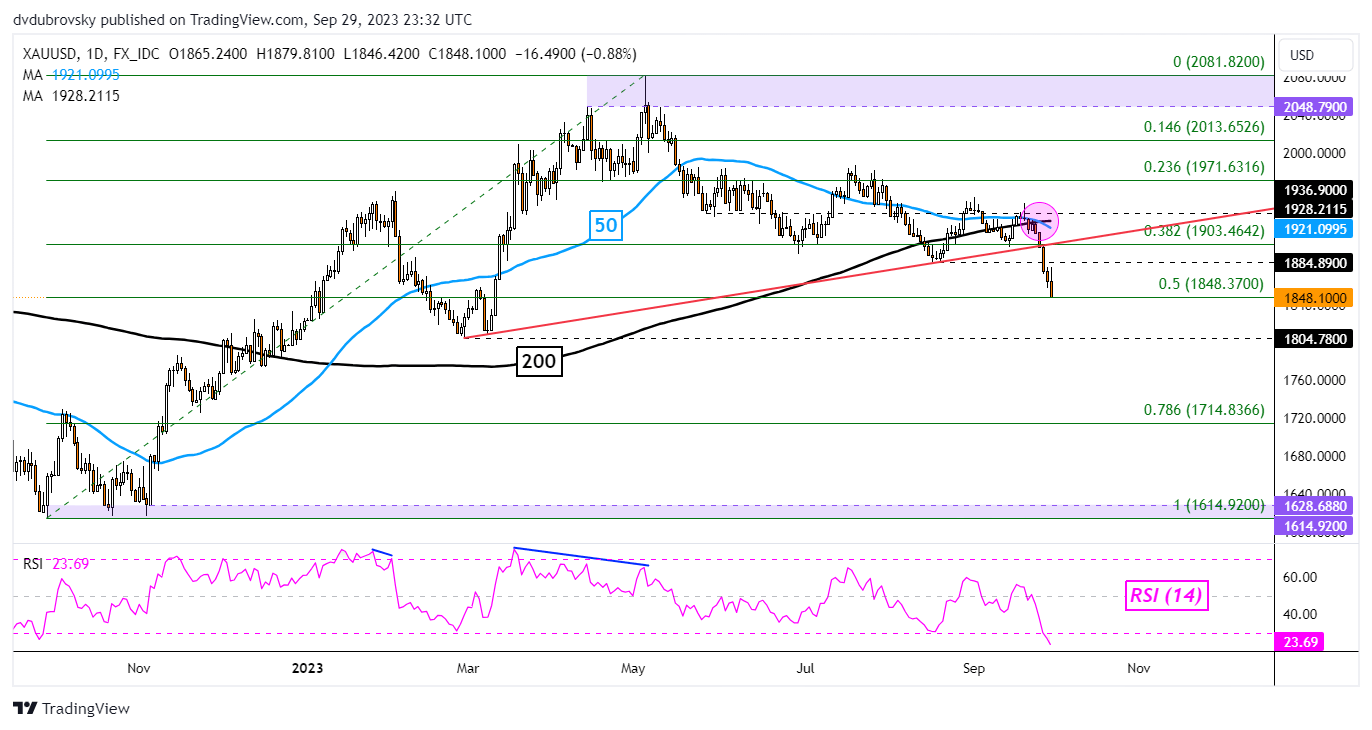
of clients arenet long. of clients arenet short. Change in Longs Shorts OI Daily -1% 8% 0% Weekly 35% -44% 11%On the daily chart, gold prices have continued to make further downside progress after confirming a breakout under the rising trendline from February. Now, a bearish Death Cross between the 50- and 200-day Moving Average has recently formed, further underscoring a bearish technical bias.
Now, prices are facing the midpoint of the Fibonacci retracement level of 1848.37. A breakout lower exposes the February low of 1804.78 before the 78.6% level of 1714.83 comes into focus. Otherwise, a turn higher places the focus on the 1884.89 inflection point.
-- Written by Daniel Dubrovsky, Senior Strategist for DailyFX.com
 |
"Simply a Must Read for Every Serious Forex Beginner" Available at Amazon Now also for Kindle
|