Recommended by Daniel Dubrovsky
How to Trade GBP/USD
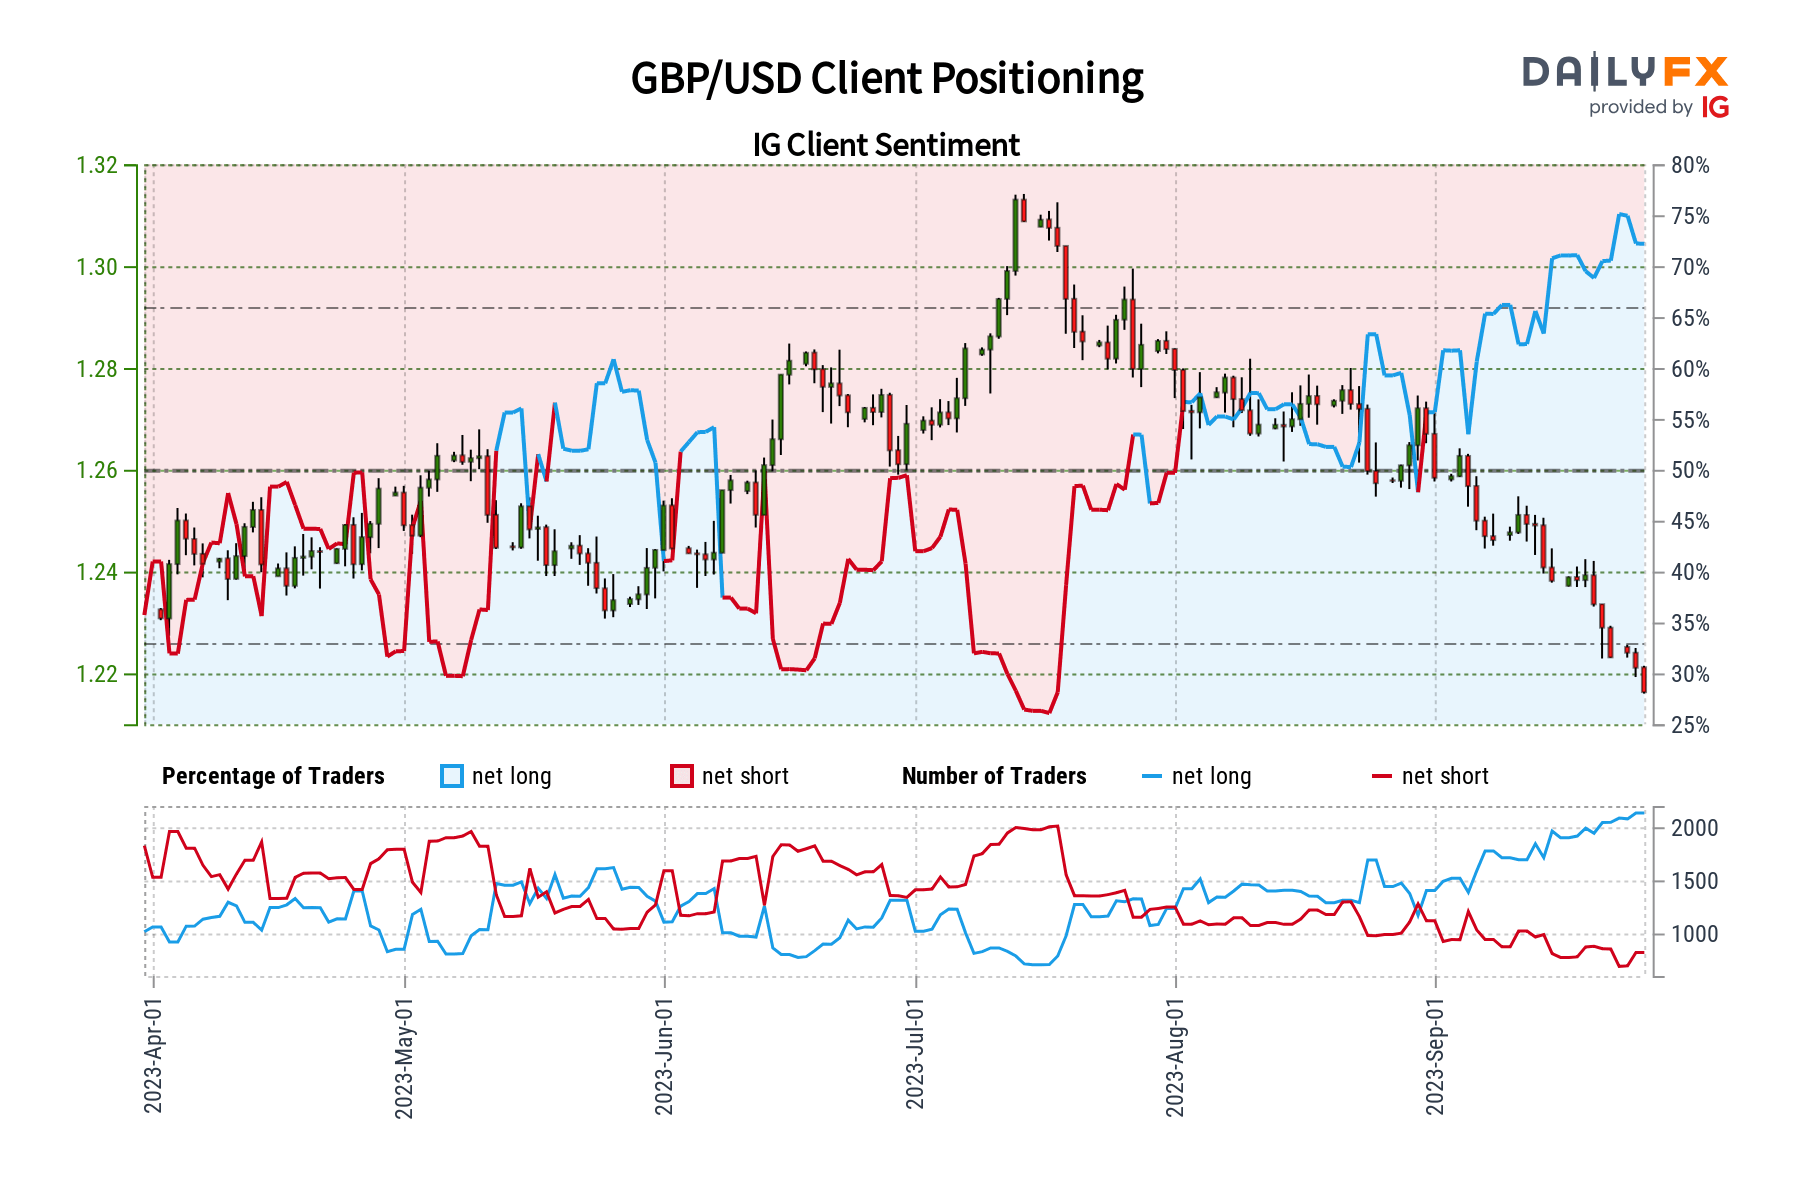
At over -4 percent, the British Pound is on course for the worst month against the US Dollar since August 2022. In response, retail traders have been relentlessly building bullish exposure. This can be seen by looking at IG Client Sentiment (IGCS), which often functions as a contrarian indicator. With that in mind, could further pain be in store for Sterling?
The IGCS gauge shows that about 71% of retail traders are net-long GBP/USD. Since the vast majority of them are biased to the upside, this continues to offer a bearish outlook for the medium term. Meanwhile, upside bets have increased by 3.29% and 12.79% compared to yesterday and last week, respectively. With that in mind, the combination of overall positioning and recent changes offers a stronger bearish outlook.
of clients arenet long. of clients arenet short. Change in Longs Shorts OI Daily 3% 0% 2% Weekly 13% -7% 7%Looking at the daily chart below, GBP/USD has continued making downside progress in the aftermath of a bearish Head & Shoulders chart formation. Since then, prices have also confirmed a breakout under the 200-day Moving Average (MA) and the May low of 1.2308. Now, immediate support is the 78.6% Fibonacci retracement level of 1.209.
Breaking lower would open the door to potentially retesting the March low of 1.1804 and further reversing the uptrend that occurred from late last year until June of this year. Otherwise, a turn higher from here places the focus on the 1.2308 inflection point.
--- Written by Daniel Dubrovsky, Senior Strategist for DailyFX.com
 |
"Simply a Must Read for Every Serious Forex Beginner" Available at Amazon Now also for Kindle
|