Recommended by Daniel Dubrovsky
Get Your Free Gold Forecast
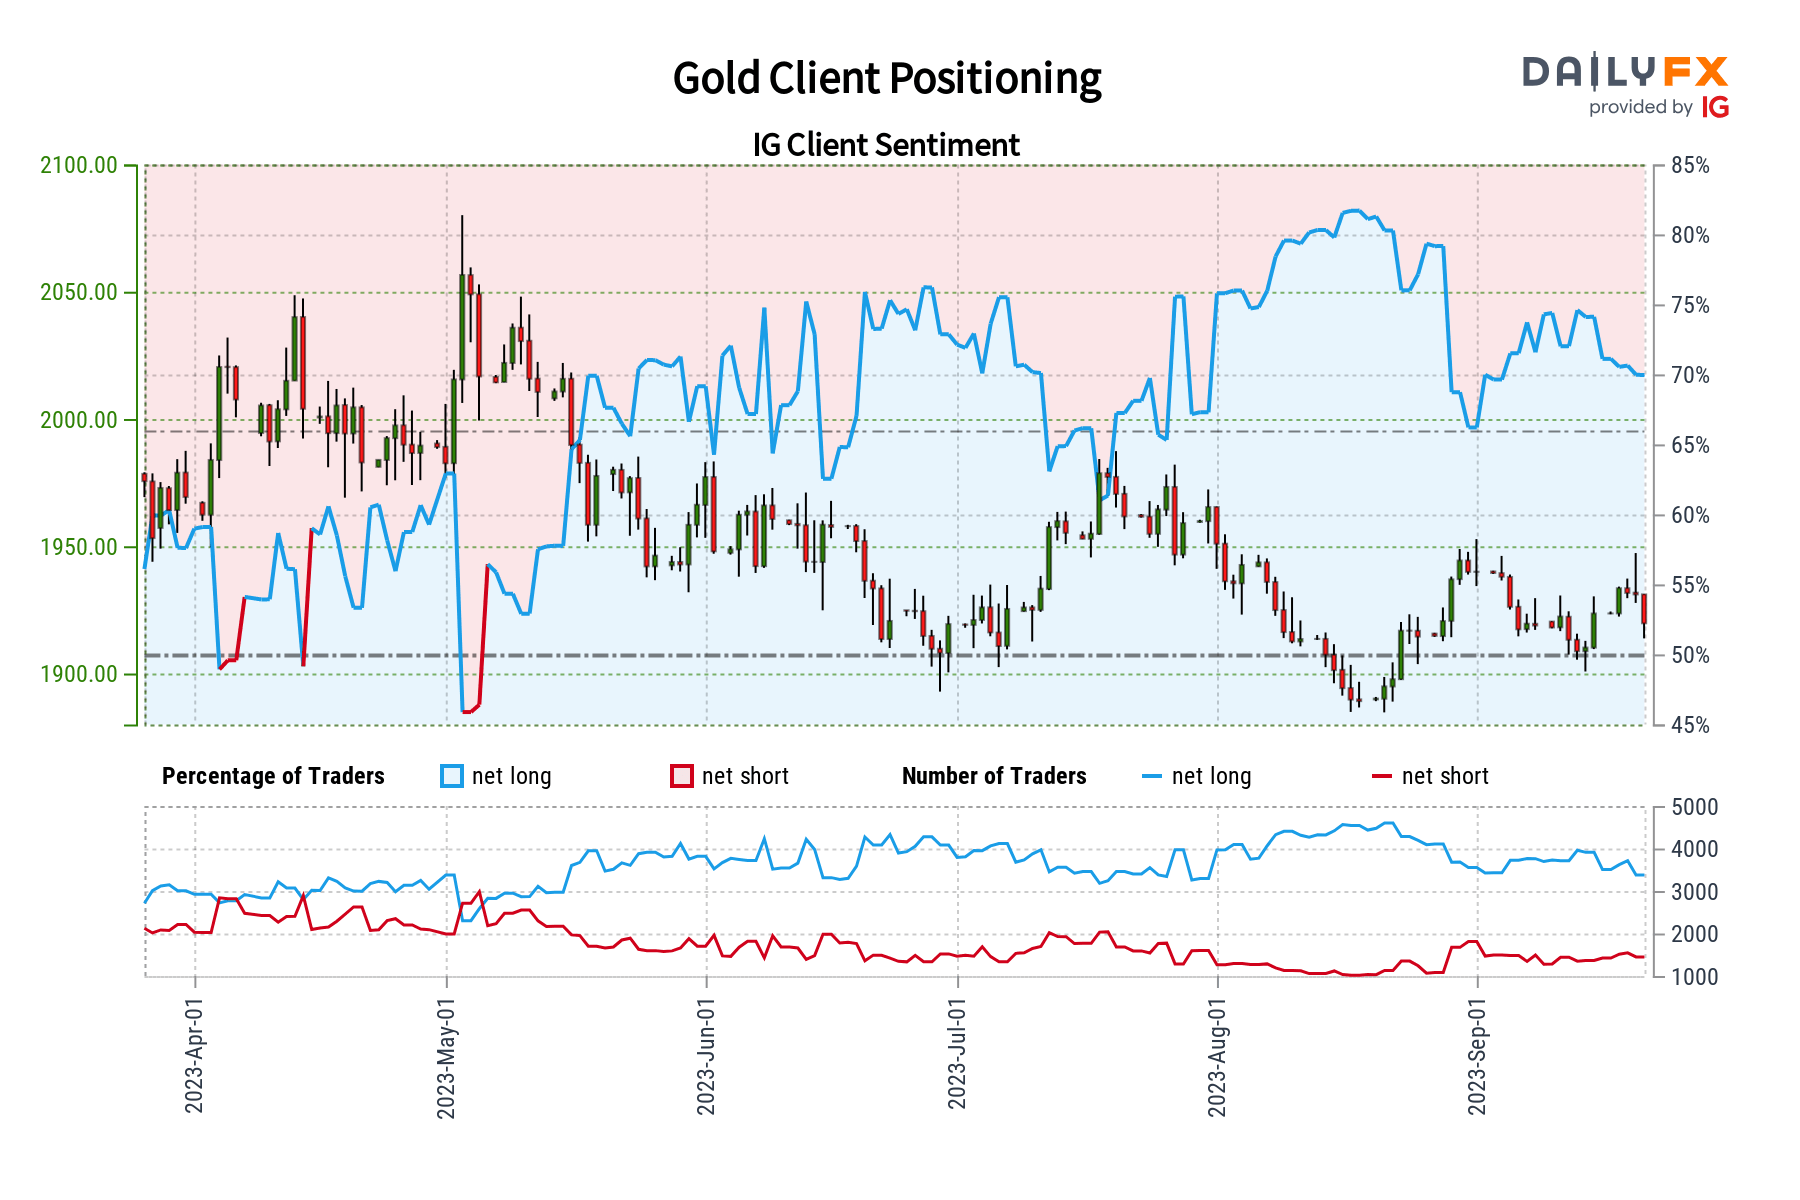
Gold prices fell about -0.6 percent over the past 24 hours as financial markets continued digesting the aftermath and implications of the Federal Reserve interest rate decision. In response, retail traders have increased bullish exposure in the precious metal. This can be seen by looking at IG Client Sentiment (IGCS), which often functions as a contrarian indicator.
The IGCS gauge shows that about 74% of retail traders are net-long gold. Since most are biased to the upside, this things that prices may continue falling down the road. Meanwhile, upside bets have increased by 8.02% and 5.9% compared to yesterday and last week, respectively. With that in mind, the combination of overall positioning and recent changes produces a stronger bearish contrarian trading bias.
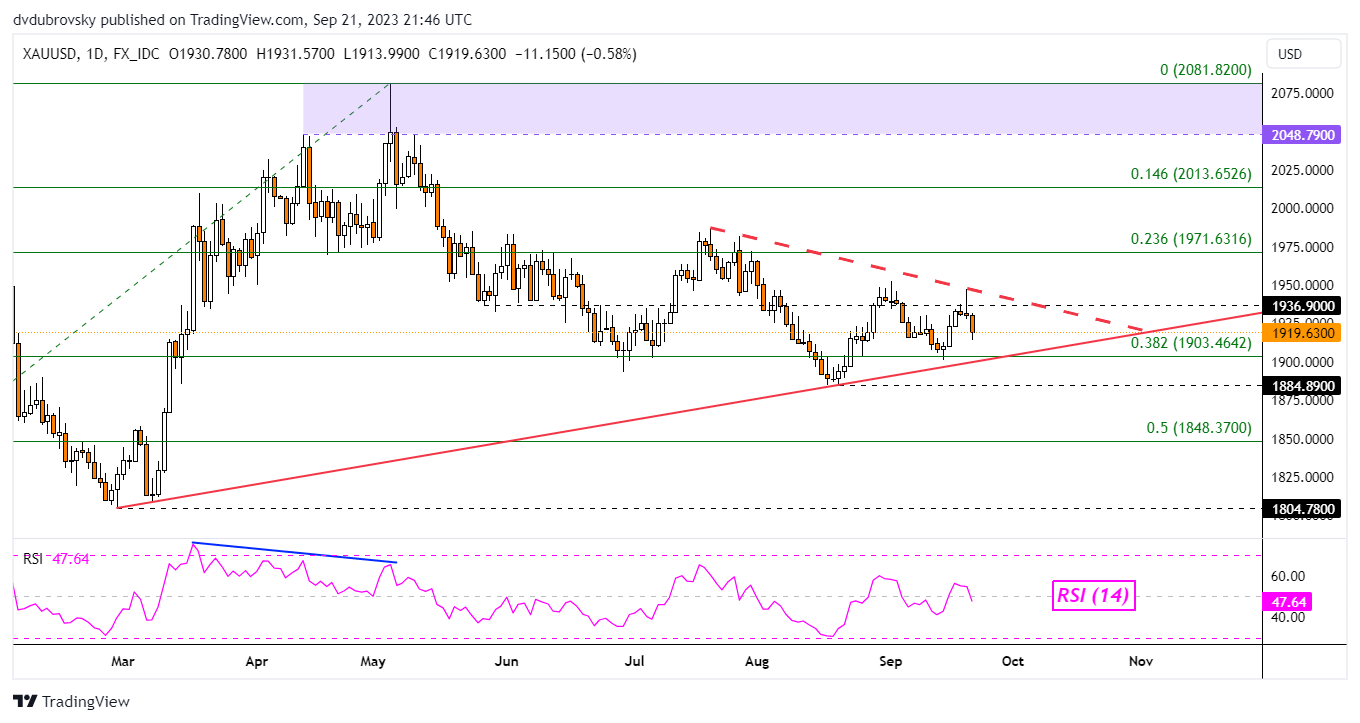
of clients arenet long. of clients arenet short. Change in Longs Shorts OI Daily 7% -9% 2% Weekly -7% -2% -5%On the daily chart, recent losses have continued pushing gold lower towards rising support from February. At the same time, near-term falling resistance from July is offering a downside trajectory. As the two trendlines converge, this brings prospects of a breakout increasingly sooner. Key support is the rising trendline, as well as the 38.2% Fibonacci retracement level of 1903.46.
Breaking lower would open the door to an increasingly bearish bias, placing the focus on the August low of 1884.89. Otherwise, a turn higher and breakout through the falling trendline exposes the 23.6% Fibonacci retracement level of 1971.63. That would offer a shift to an increasingly bullish technical outlook.
-- Written by Daniel Dubrovsky, Senior Strategist for DailyFX.com
 |
"Simply a Must Read for Every Serious Forex Beginner" Available at Amazon Now also for Kindle
|