Recommended by Daniel Dubrovsky
Get Your Free Oil Forecast
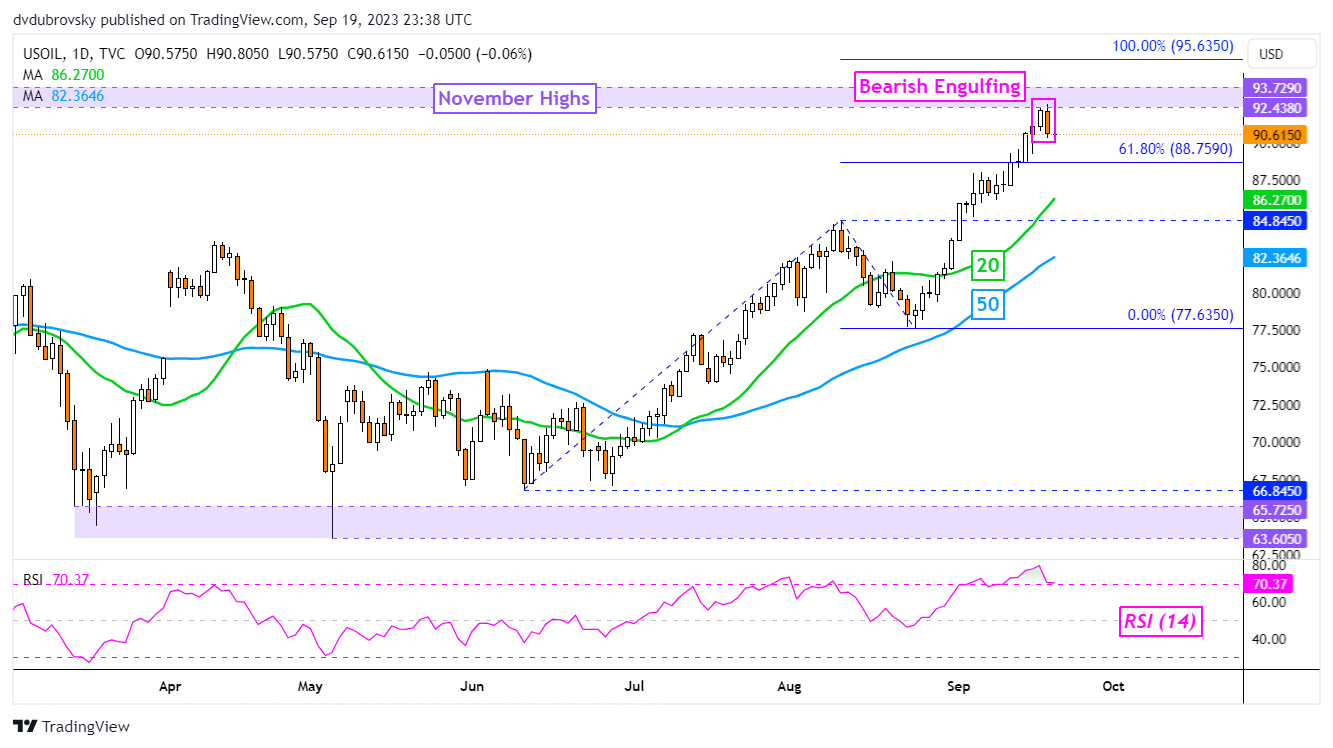
WTI crude oil prices might be showing early signs of topping that might be worth paying attention to from a technical standpoint. On the daily chart below, a Bearish Engulfing has emerged. Downside confirmation is lacking at this stage, however. Further downside from here could underscore the candlestick pattern.
This is as prices trade just beneath the 92.43 – 93.72 resistance zone, which is made up of highs from November. In the event of a turn lower, keep a close eye on the 61.8% Fibonacci extension level at 88.75 before the 20-day Moving Average kicks in. Otherwise, clearing resistance exposes the 100% level at 95.63.
of clients arenet long. of clients arenet short. Change in Longs Shorts OI Daily 0% -6% -4% Weekly -9% -1% -4%Chart Created in TradingView
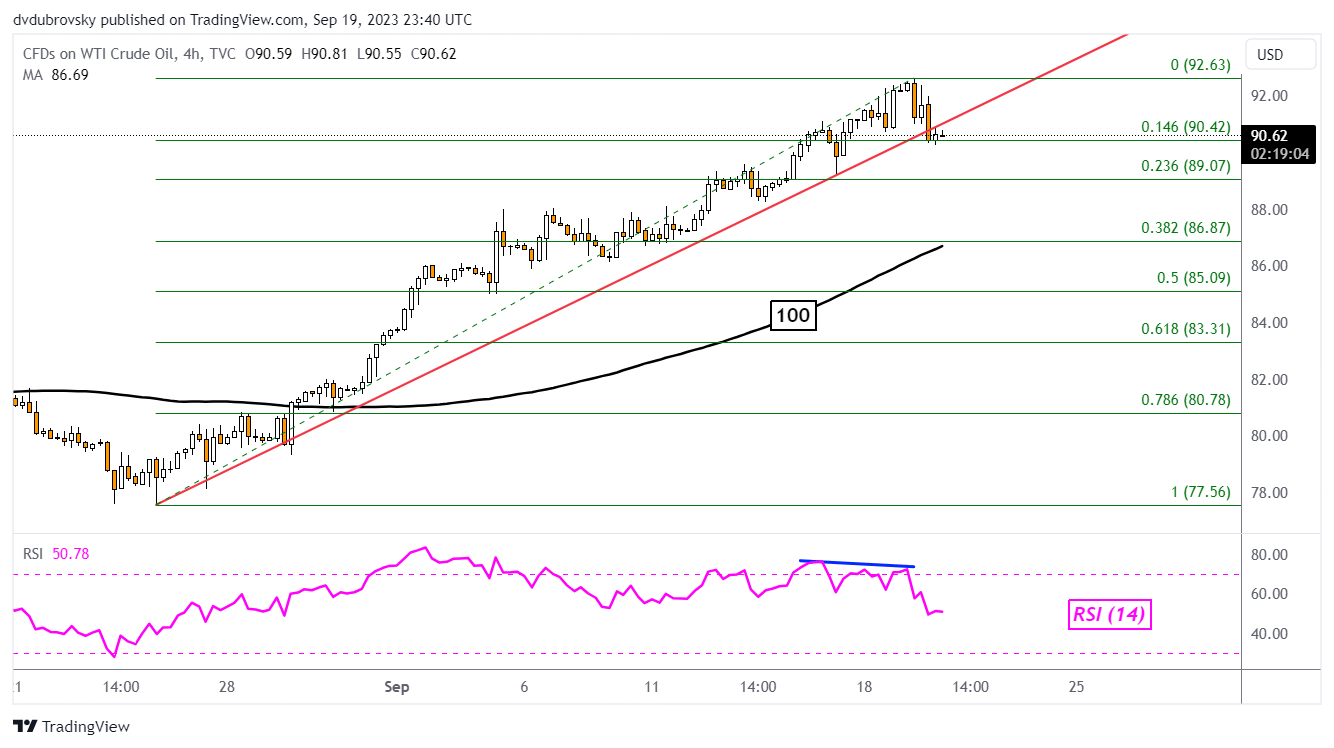
Zooming in on the 4-hour setting may offer better insight into what key levels to watch in the event of extended losses. For starters, on this timeframe, WTI is sitting around the near-term rising trendline from the end of August. A confirmatory downside breakout would underscore an increasingly near-term bearish technical bias.
Meanwhile, negative RSI divergence shows that upside momentum is fading. That can at times precede a turn lower. Such a case would expose the 23.6% and 38.2% Fibonacci retracement levels at 89.07 and 86.87, respectively. The latter is also closely aligned with the 100-day Moving Average, which may reinstate the broader upside bias.
Chart Created in TradingView
--- Written by Daniel Dubrovsky, Strategist for DailyFX.com
 |
"Simply a Must Read for Every Serious Forex Beginner" Available at Amazon Now also for Kindle
|