Recommended by Daniel Dubrovsky
Get Your Free Gold Forecast
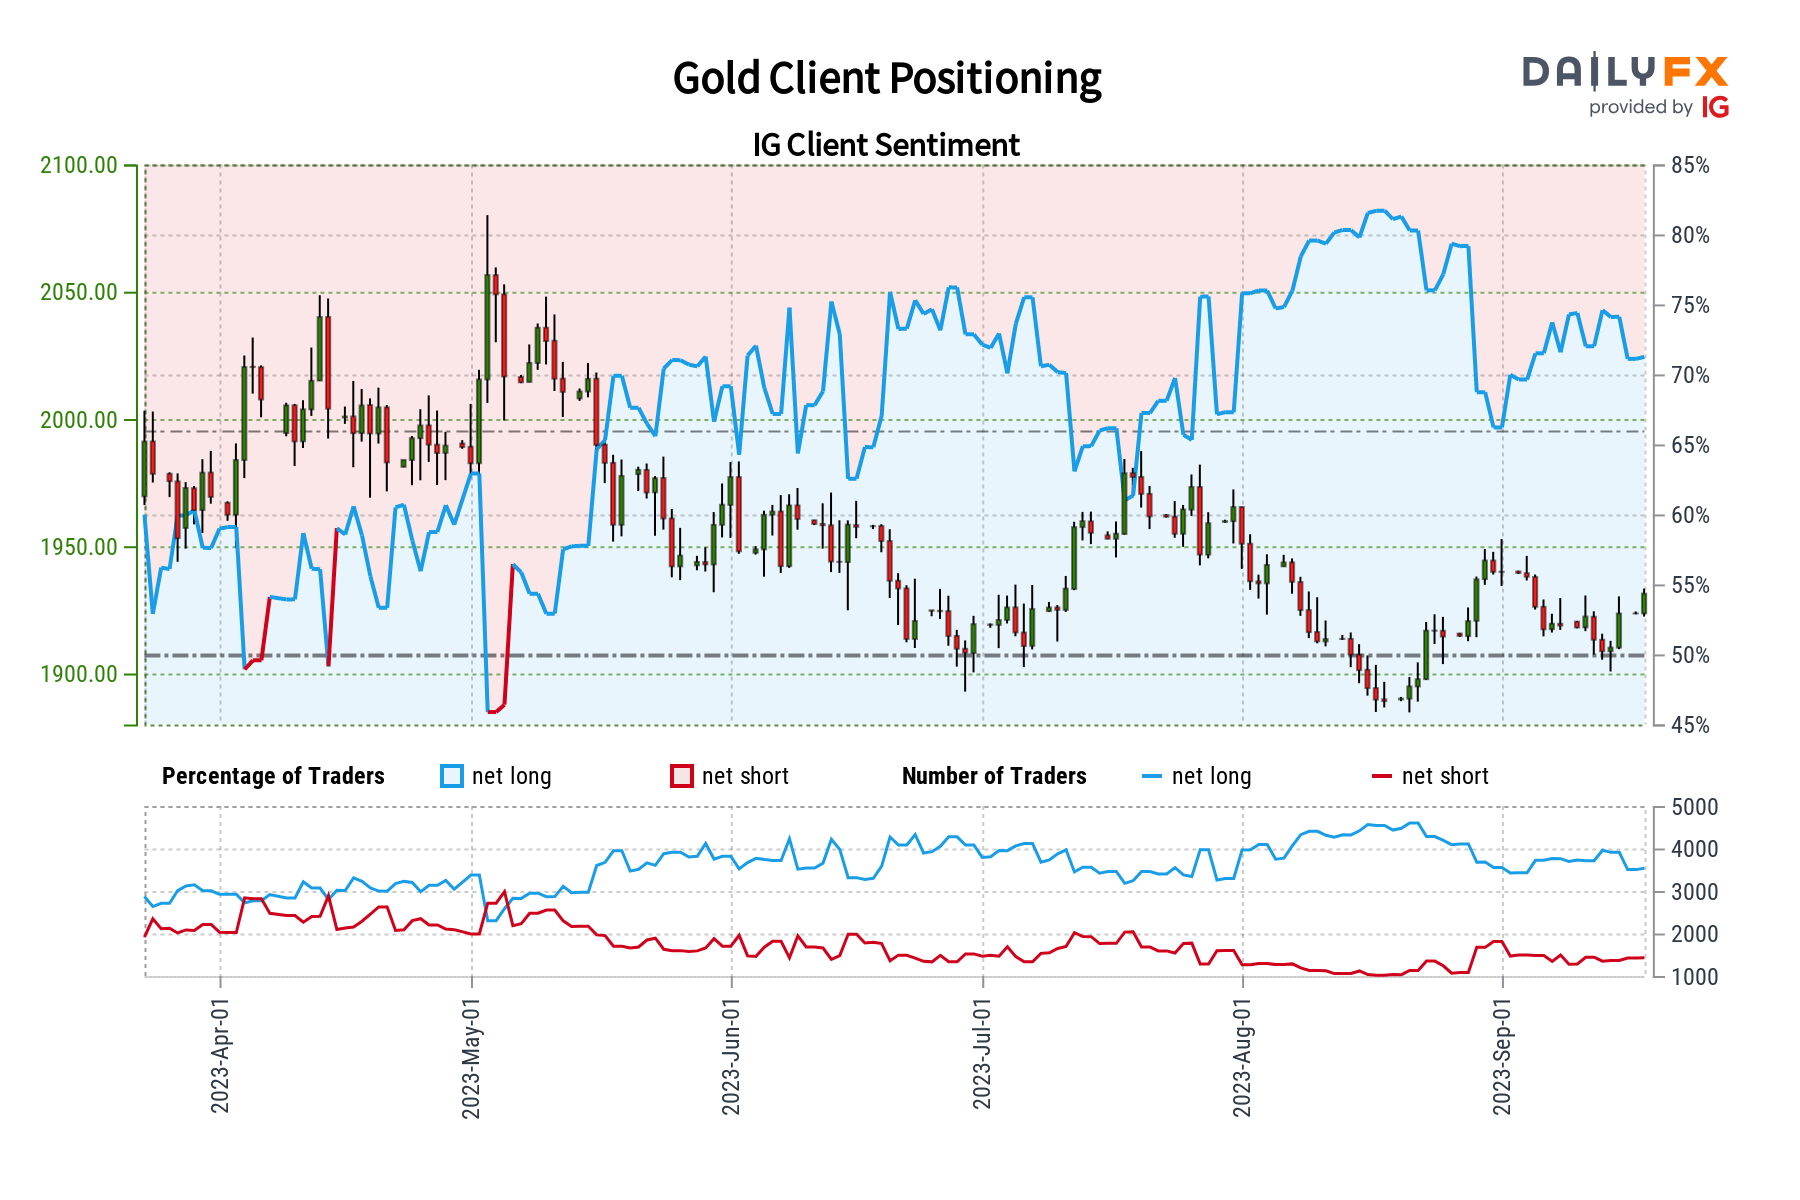
Gold prices have rallied for a couple of trading sessions and retail traders have responded by increasing their downside exposure. This can be seen by looking at IG Client Sentiment (IGCS), which often functions as a contrarian indicator. With that in mind, will an increasing shift in retail exposure offer a warm welcome for the yellow metal?
The IGCS gauge shows that about 70% of retail traders are net-long gold. Since the majority of them are biased to the upside, this still could spell trouble for gold down the road. That said, downside exposure has increased by 9.49% and 3.59% compared to yesterday and last week, respectively. With that in mind, recent changes in exposure hint that the price trend may soon reverse higher.
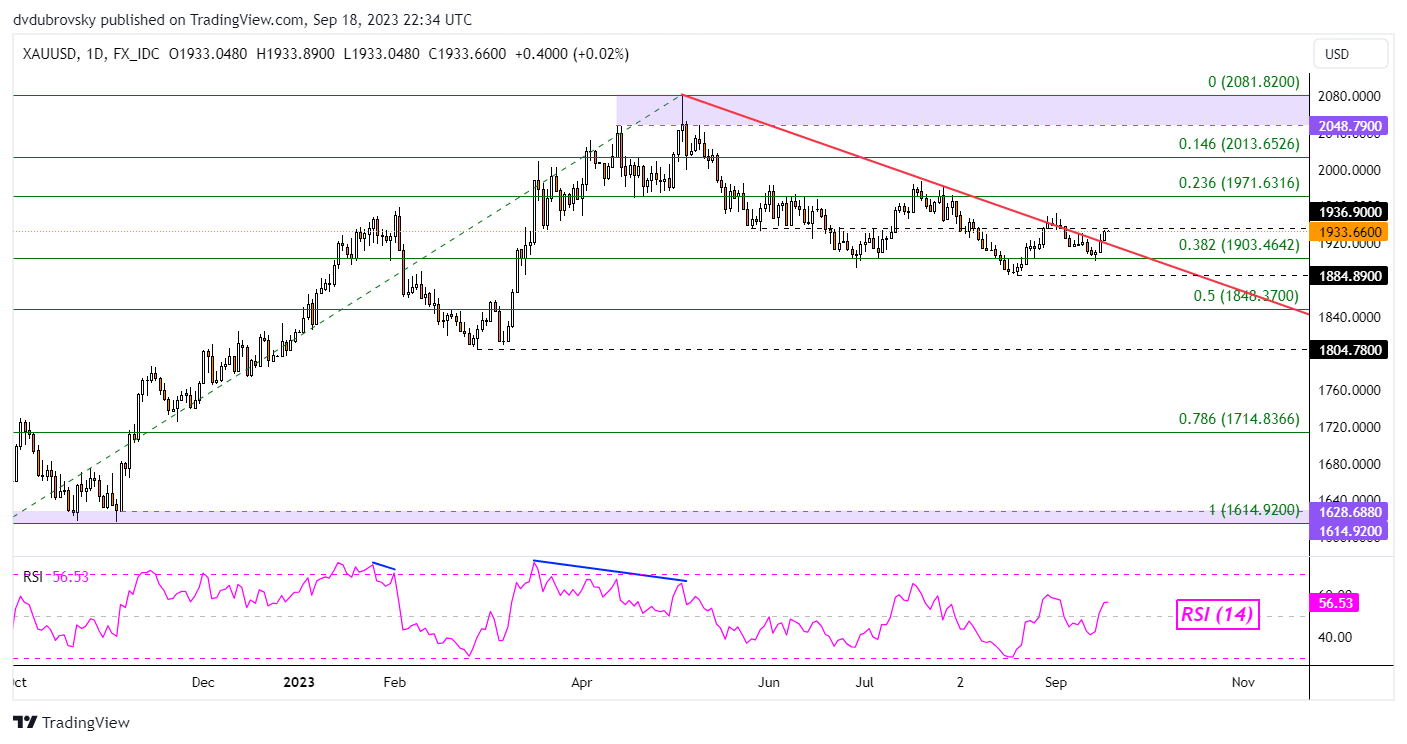
of clients arenet long. of clients arenet short. Change in Longs Shorts OI Daily 2% 9% 4% Weekly -3% 6% 0%On the daily chart, recent gains have pushed gold prices to flirt confirming a breakout above the falling trendline from May. Immediate resistance is the 1936.90 inflection point. A push above that exposes the 23.6% Fibonacci retracement level of 1971.63, opening the door to an increasingly bullish technical bias.
Otherwise, a false breakout places the focus back on the 38.2% point around 1903.46 before exposing the August swing low of 1884.37. Confirming a breakout under the latter opens the door to extending the downtrend since May.
-- Written by Daniel Dubrovsky, Senior Strategist for DailyFX.com
 |
"Simply a Must Read for Every Serious Forex Beginner" Available at Amazon Now also for Kindle
|