Recommended by Daniel Dubrovsky
What is the outlook for the US Dollar?
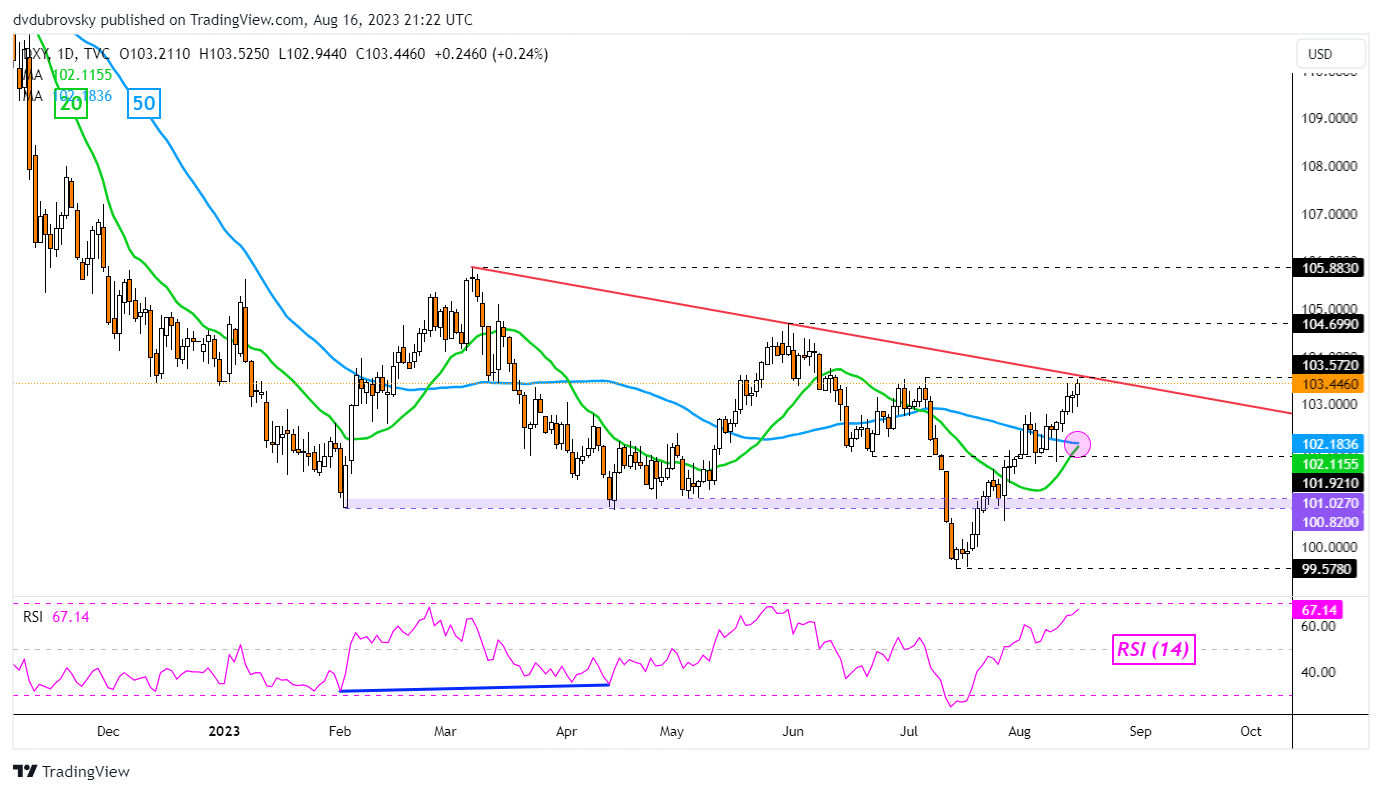
The US Dollar extended its winning streak over the past 24 hours. So far this week, the DXY Dollar Index is up about 0.6 percent, aiming for a 5th consecutive weekly gain. If confirmed, that would be the longest winning streak since early May 2022. With that in mind, the currency now faces its next critical technical challenge.
DXY now sits just below the key falling trendline from February which has been maintaining the broader downside focus. On top of that, the line is currently closely aligned with the July high of 103.57. As such, this could be a difficult point to breach for bulls.
Still, a bullish Golden Cross is on the verge of forming between the 20- and 50-day Moving Averages (MAs). This is supporting a near-term upside technical bias. Breaking above resistance exposes the May high of 104.69 before the February peak of 105.88 comes into focus. Otherwise, a turn lower places the focus on the MAs for support.
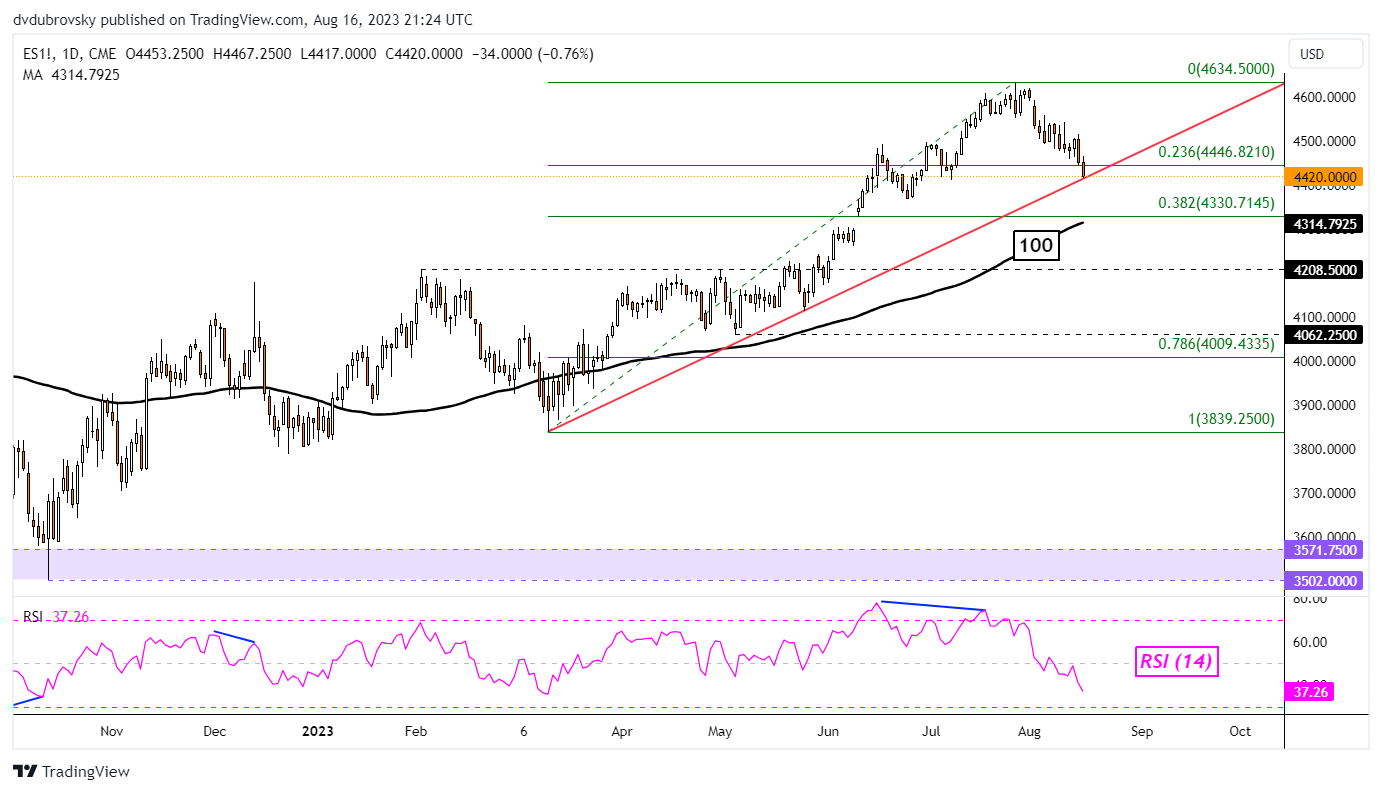
Unlike the US Dollar, the S&P 500 has now dropped to key rising support from March. So far this week, the stock market index is down about -1.4 percent. If losses are sustained, this will be the 3rd consecutive weekly loss, the longest losing streak since late February.
Breaking under the trendline, with confirmation, offers an increasingly bearish technical bias. That places the focus on the combination of the 38.2% Fibonacci retracement level of 4330 and the 100-day Moving Average. These may hold as key support, reinstating a broader bullish bias. Otherwise, if the trendline holds here, a pivot higher places the focus on the July high of 4634.
of clients arenet long. of clients arenet short. Change in Longs Shorts OI Daily 5% -5% -1% Weekly 15% -7% 1%--- Written by Daniel Dubrovsky, Strategist for DailyFX.com
 |
"Simply a Must Read for Every Serious Forex Beginner" Available at Amazon Now also for Kindle
|