| SYMBOL | TRADING BIAS | NET-LONG% | NET-SHORT% | CHANGE IN LONGS | CHANGE IN SHORTS | CHANGE IN OI |
|---|---|---|---|---|---|---|
| FTSE 100 | BULLISH | 49.39% | 50.61% |
-7.98%Daily -23.50%Weekly |
-0.89%Daily 23.27%Weekly |
-4.53%Daily -5.32%Weekly |
| Change in | Longs | Shorts | OI |
| Daily | -7% | 5% | -2% |
| Weekly | -18% | 16% | -5% |
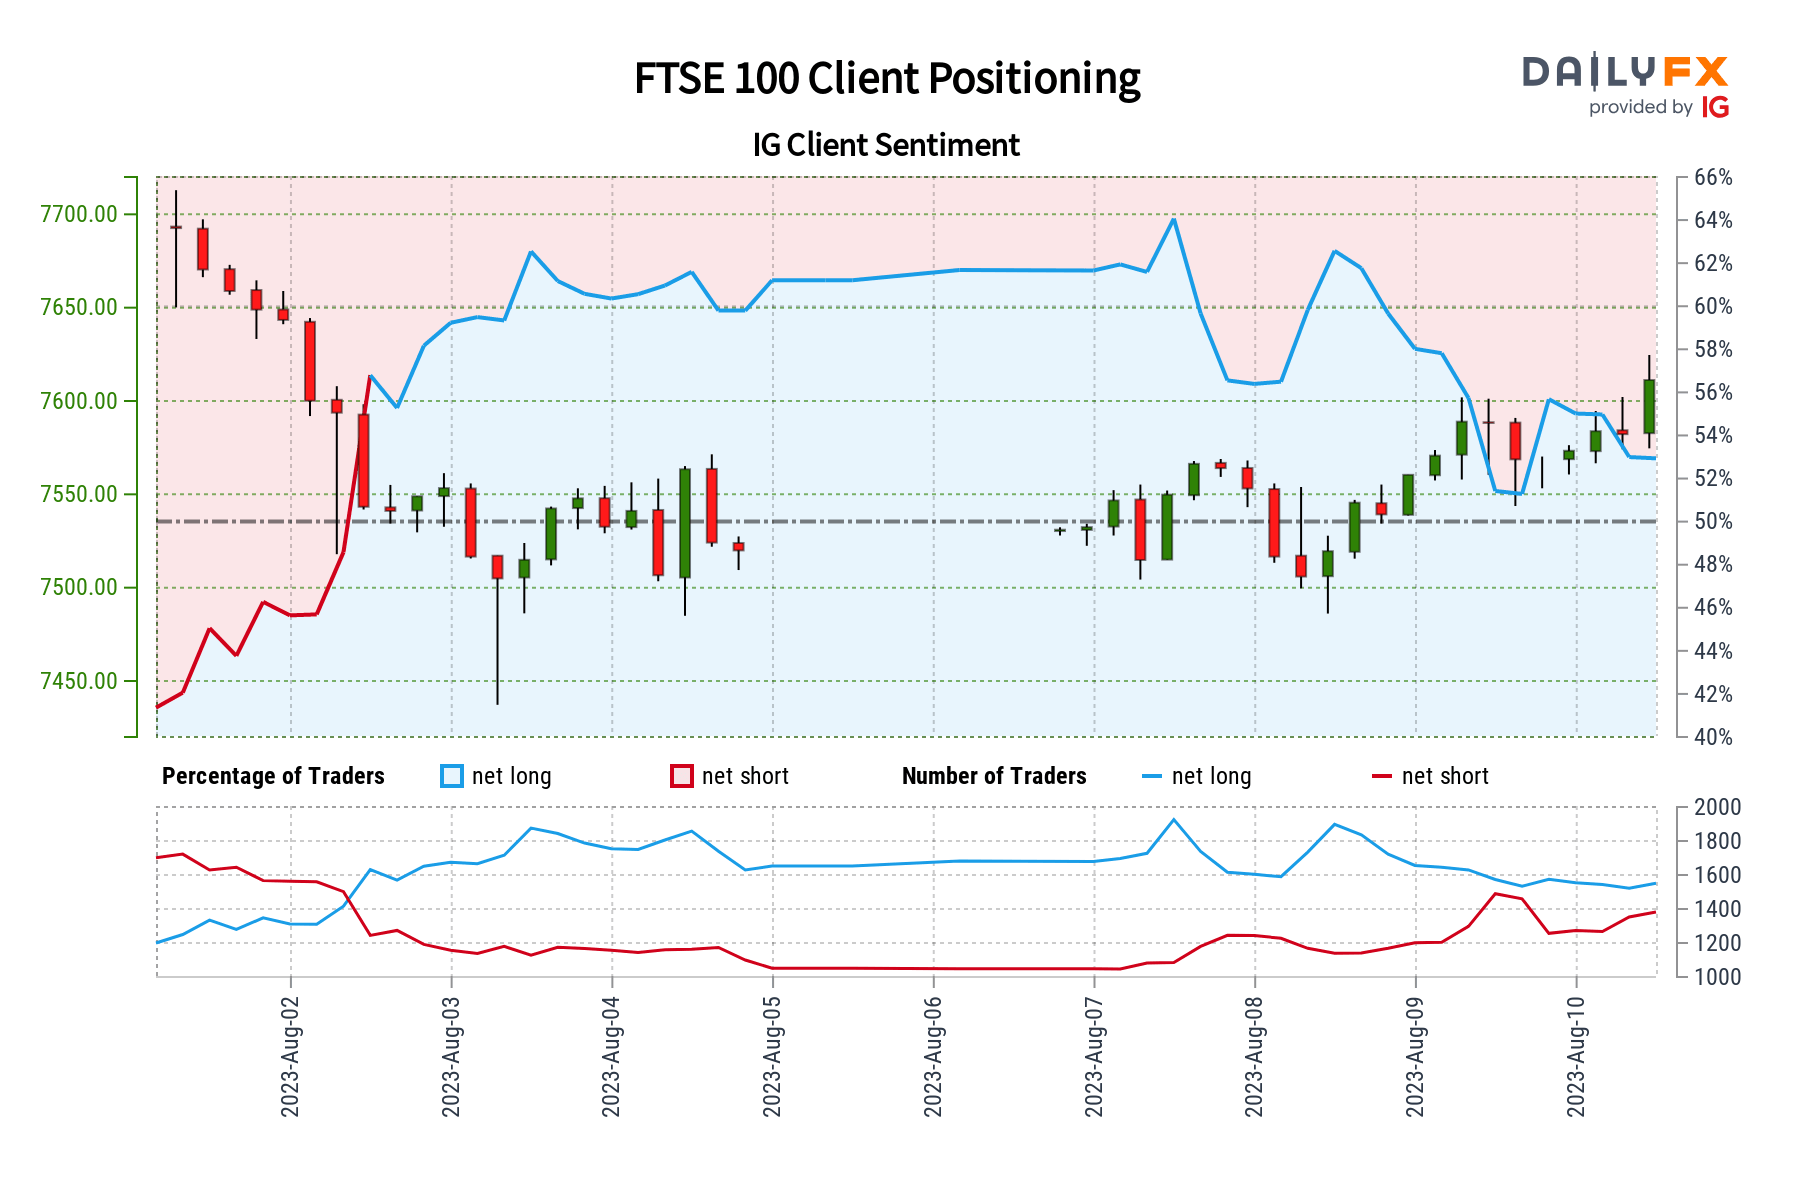
FTSE 100: Retail trader data shows 49.39% of traders are net-long with the ratio of traders short to long at 1.02 to 1.In fact, traders have remained net-short since Aug 02 when FTSE 100 traded near 7,548.40, price has moved 0.84% higher since then. The number of traders net-long is 7.98% lower than yesterday and 23.50% lower from last week, while the number of traders net-short is 0.89% lower than yesterday and 23.27% higher from last week.
We typically take a contrarian view to crowd sentiment, and the fact traders are net-short suggests FTSE 100prices may continue to rise.
Our data shows traders are now net-short FTSE 100 for the first time since Aug 02, 2023 08:00 GMT when FTSE 100 traded near 7,548.40. Traders are further net-short than yesterday and last week, and the combination of current sentiment and recent changes gives us a stronger FTSE 100-bullish contrarian trading bias.
Source https://www.dailyfx.com/analysis/FT100-IG-Client-Sentiment-202308101623.html
 |
"Simply a Must Read for Every Serious Forex Beginner" Available at Amazon Now also for Kindle
|