Recommended by Daniel Dubrovsky
Get Your Free Equities Forecast
Equities were left relatively unscathed following this month’s Federal Reserve interest rate hike. A pause is mostly priced in for September, beyond that policymakers have stressed a data-dependent approach. In response, retail traders have increased downside exposure in the Dow Jones and S&P 500. This can be seen by looking at IG Client Sentiment (IGCS). IGCS tends to behave as a contrarian indicator. With that in mind, could equities continue higher from here?
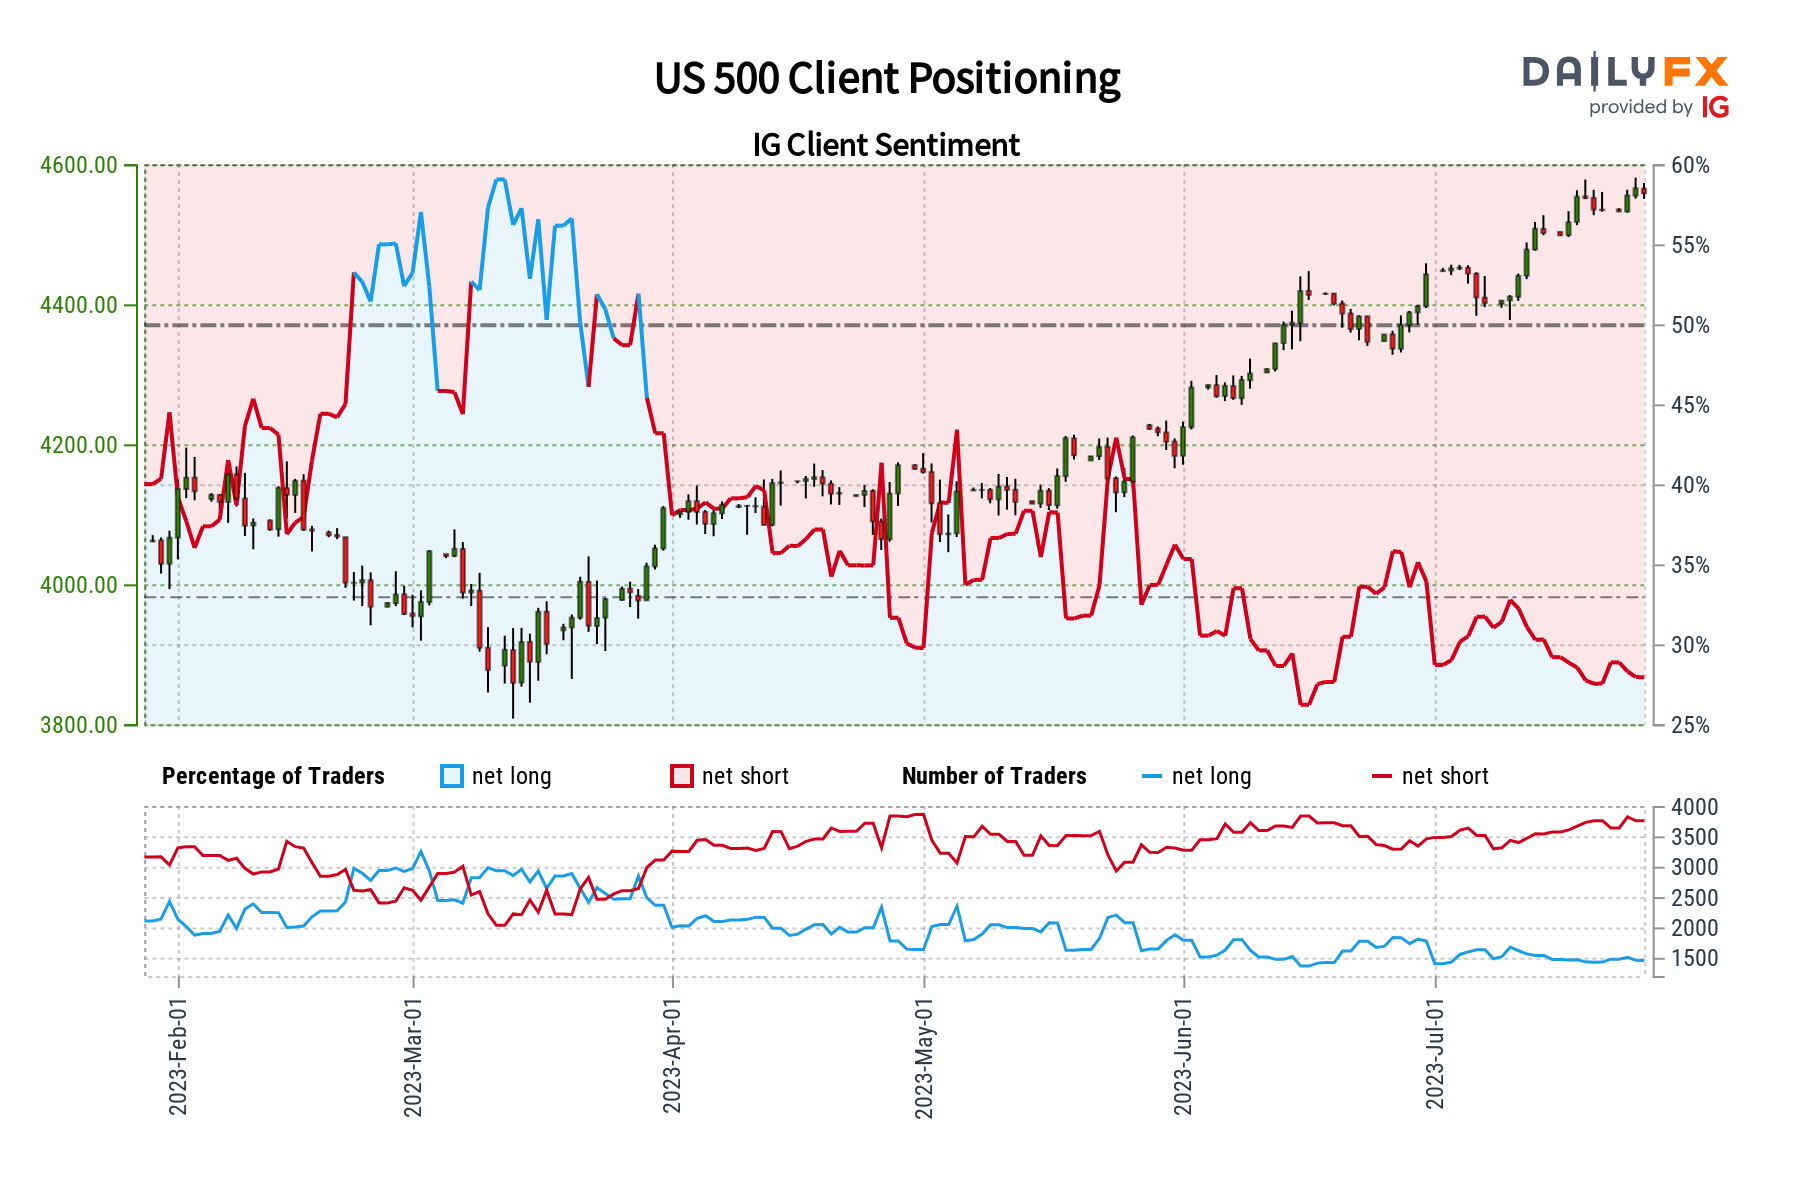
According to IGCS, about 19% of retail traders are net-long the Dow Jones. Since most of them are biased lower, this hints prices may keep rising. This is as downside exposure increased by 4.02% and 22.81% compared to yesterday and last week, respectively. With that in mind, the combination of overall exposure and recent changes in it produces a stronger bullish contrarian trading bias.
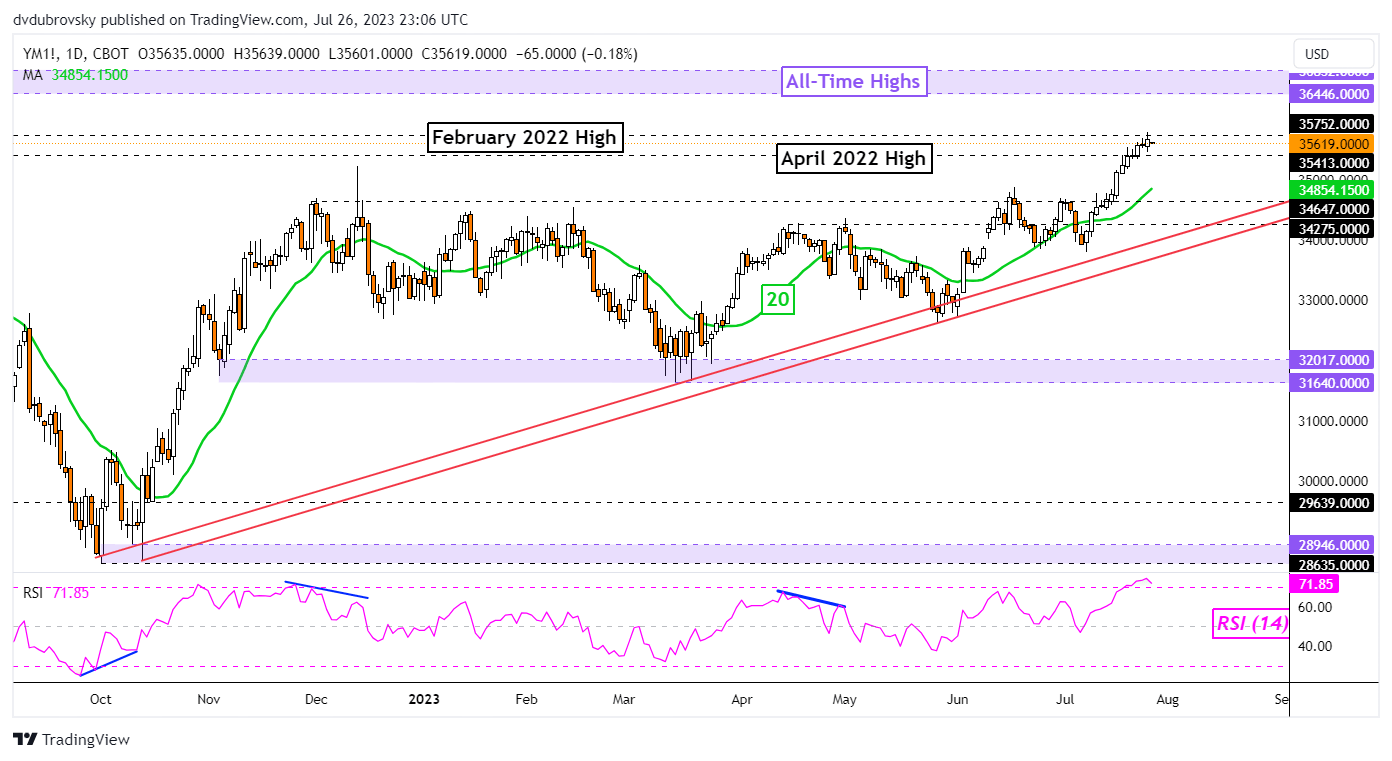
The Dow Jones sits just under the February 2022 high at 35752, which is immediate resistance. Clearing this point exposes all-time highs, making for a zone of resistance between 36446 and 36832. In the event of a turn lower, that places the focus on the 20-day Moving Average (MA). This may hold as support, maintaining an upside bias.
According to IGCS, about 29% of retail traders are net-long the S&P 500. Since most of them are still biased lower, this hints that prices may continue rising. This is as downside exposure increased by 0.55% and 2.55% compared to yesterday and last week, respectively. With that in mind, the combination of current positioning and recent changes offers a stronger bullish contrarian trading bias.
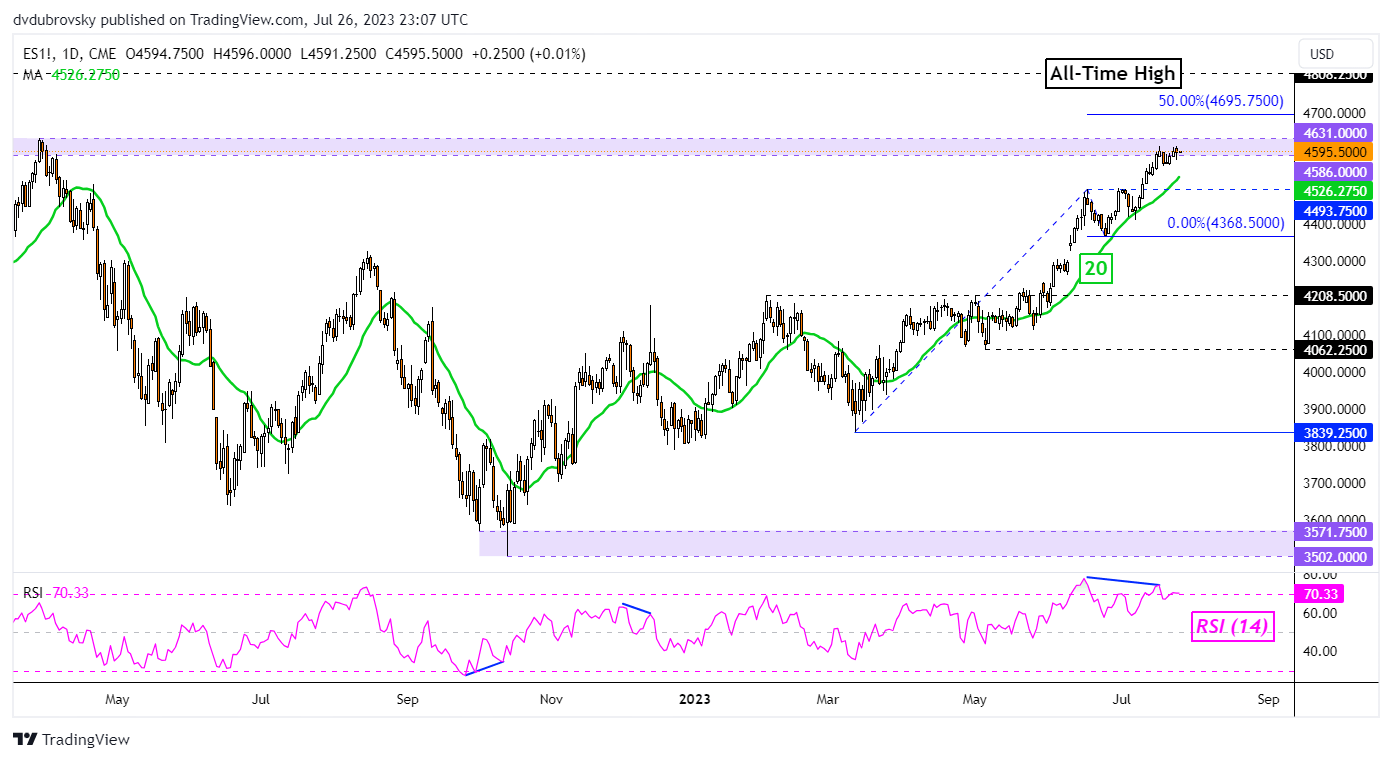
The S&P 500 has climbed to the critical 4586 – 4631 resistance zone, which is made up of peaks in March 2022. However, negative RSI divergence is present. This shows that upside momentum is fading, which can at times precede a turn lower. That would place the focus on the 20-day MA. Otherwise, clearing higher exposes the midpoint of the Fibonacci extension level at 4695.
--- Written by Daniel Dubrovsky, Senior Strategist for DailyFX.com
 |
"Simply a Must Read for Every Serious Forex Beginner" Available at Amazon Now also for Kindle
|