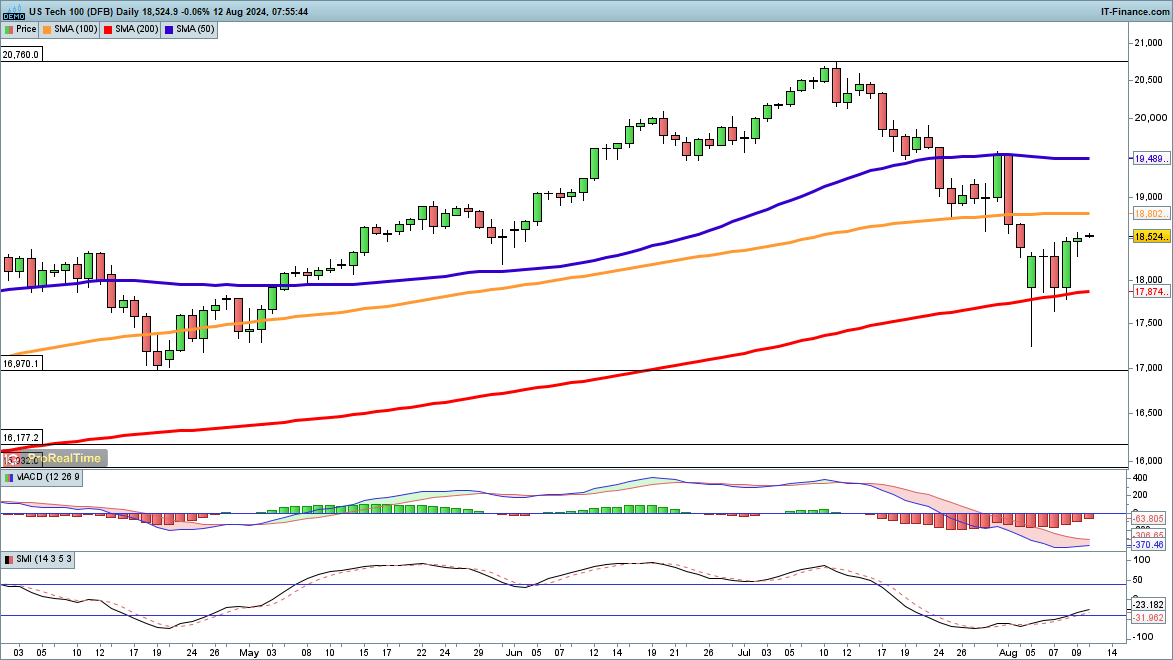
?The index finished up on the week, having rallied back above 18,000 as well as holding above the 200-day SMA.?For the moment the buyers remain in control, having lifted the index from its lows. Further gains target 19,000 and then the late July high at 19,500. A close back below 18,000 might signal that a new leg lower has begun.
Nasdaq100 Daily Chart
Recommended by Chris Beauchamp
Building Confidence in Trading
?
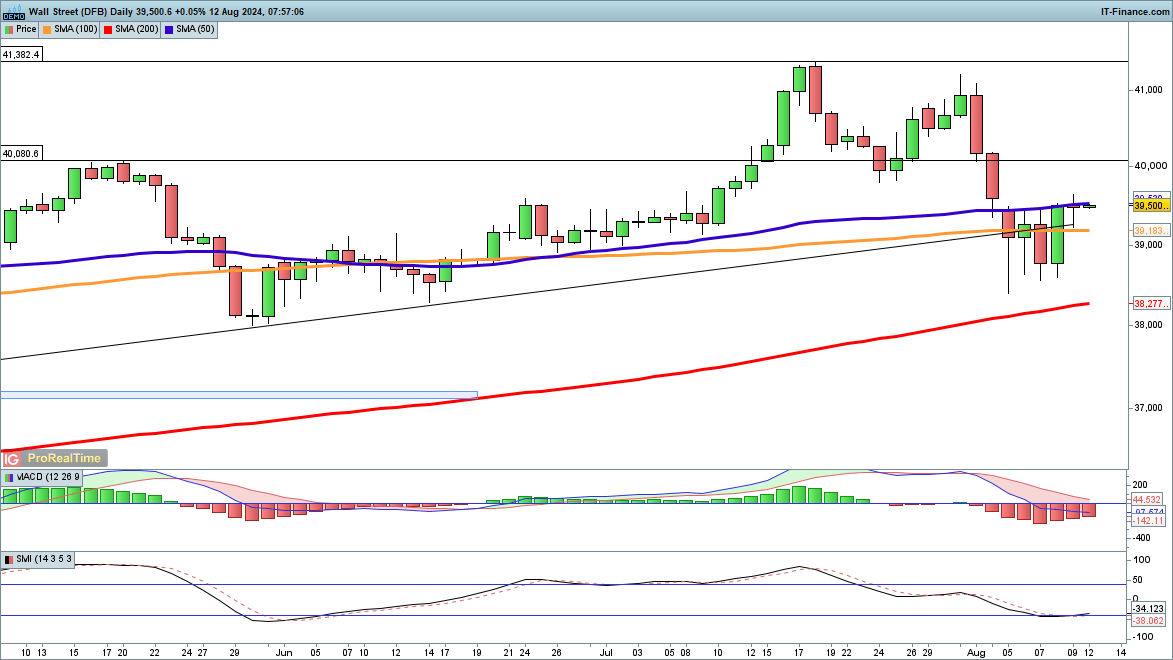
?A bullish view prevails here too, after the index rebounded from the lows of the week around 38,500.
?A close back above the 50-day SMA would help to bolster the bullish view, and open the way to 40,000 and higher. Sellers will need a close back below 39,000 to suggest a retest of the recent lows.
Dow Jones Daily Chart
of clients arenet long. of clients arenet short. Change in Longs Shorts OI Daily 62% 6% 15% Weekly 5% 9% 8%?
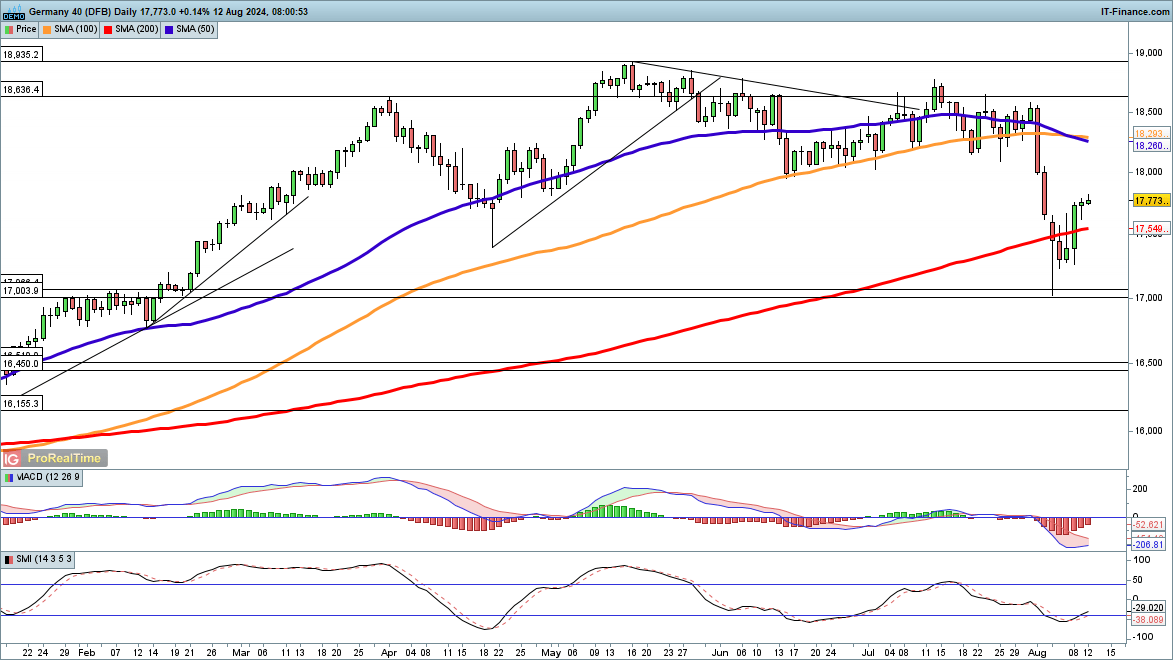
?Having nearly hit 17,000 last week the index has recovered well, moving back above the 200-day SMA.
?It has recovered the April low, and now looks poised to test 18,000. A close above this helps to support a view that the index will retest the July highs. Sellers will want to see a close back below 17,500 to put it back below the 200-day SMA.
DAX Daily Chart
Source https://www.dailyfx.com/news/nasdaq-100-dow-and-dax-continue-to-rebound-20240812.html
 |
"Simply a Must Read for Every Serious Forex Beginner" Available at Amazon Now also for Kindle
|