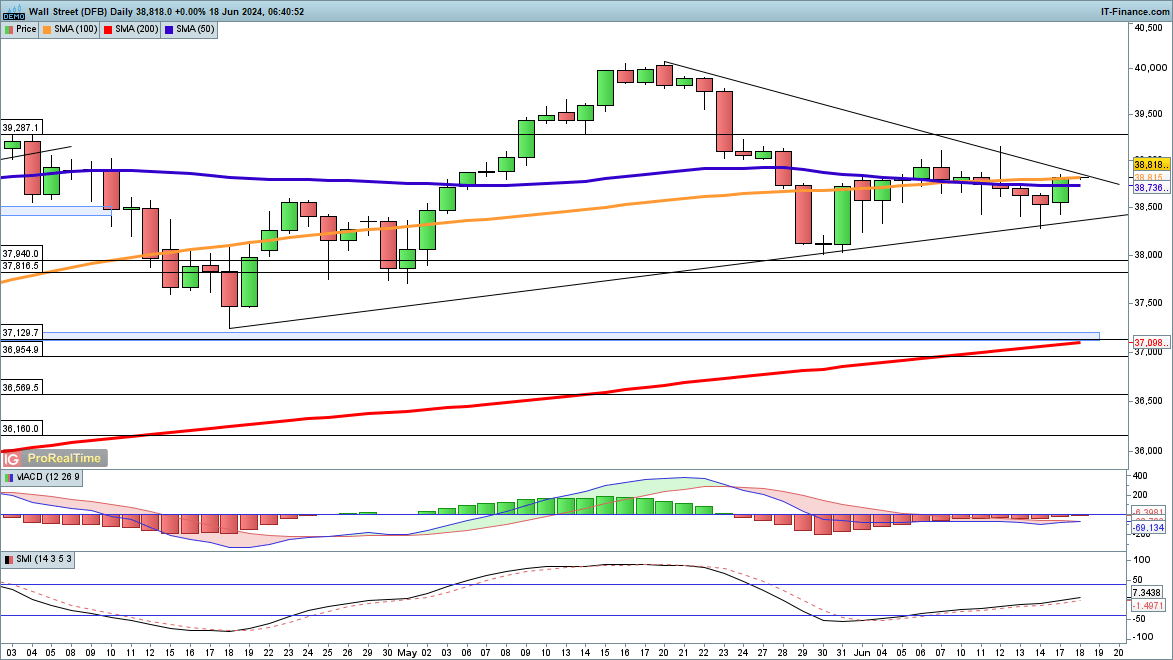
?The index rallied on Monday, helping to stem the declines of the past week. Friday witnessed a bounce from rising trendline support, and now the price targets trendline resistance from the May record high.?A close above trendline resistance and above 39,000 puts the index on course to test 40,000 once more. A reversal back below trendline support and below 38,300 would see a more bearish view emerge.
?Dow Jones Daily Chart
of clients arenet long. of clients arenet short.| Change in | Longs | Shorts | OI |
| Daily | 0% | 0% | 0% |
| Weekly | 3% | -3% | 0% |
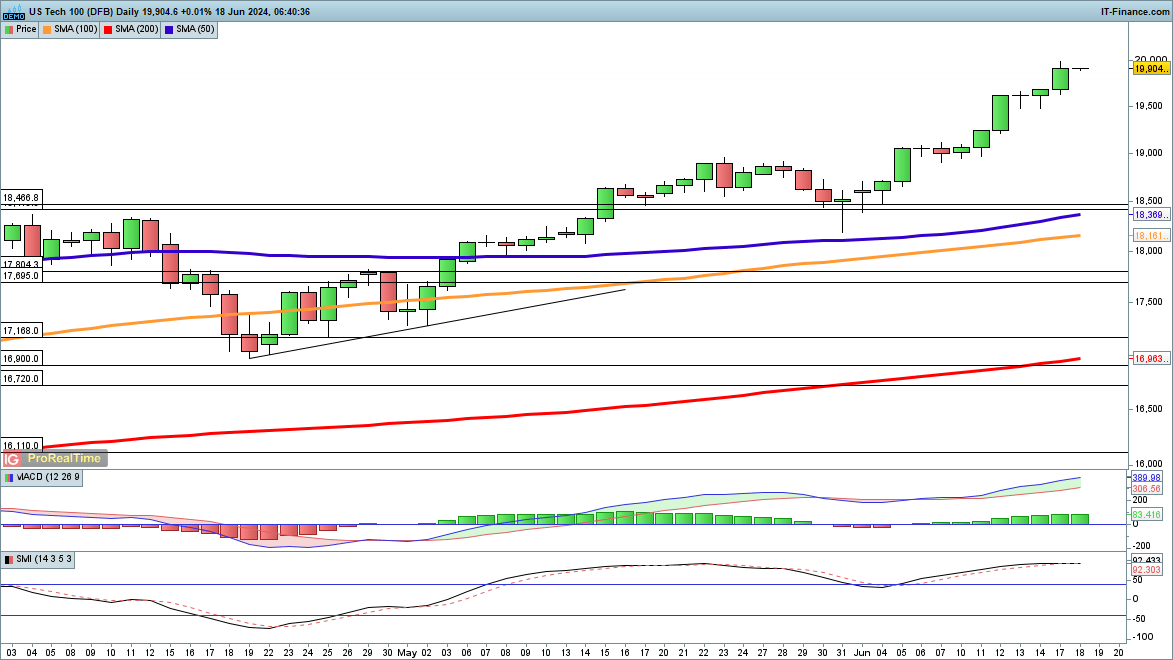
?Monday’s session saw the index come within a whisker of 20,000. The recent surge has seen the price smash through previous record highs, with no sign of a reversal yet in play. ?
?Further gains head into fresh unexplored territory. In the short term, a close back below 19,500 might indicate that a high has been reached for the time being.
Nasdaq 100 Daily Chart?
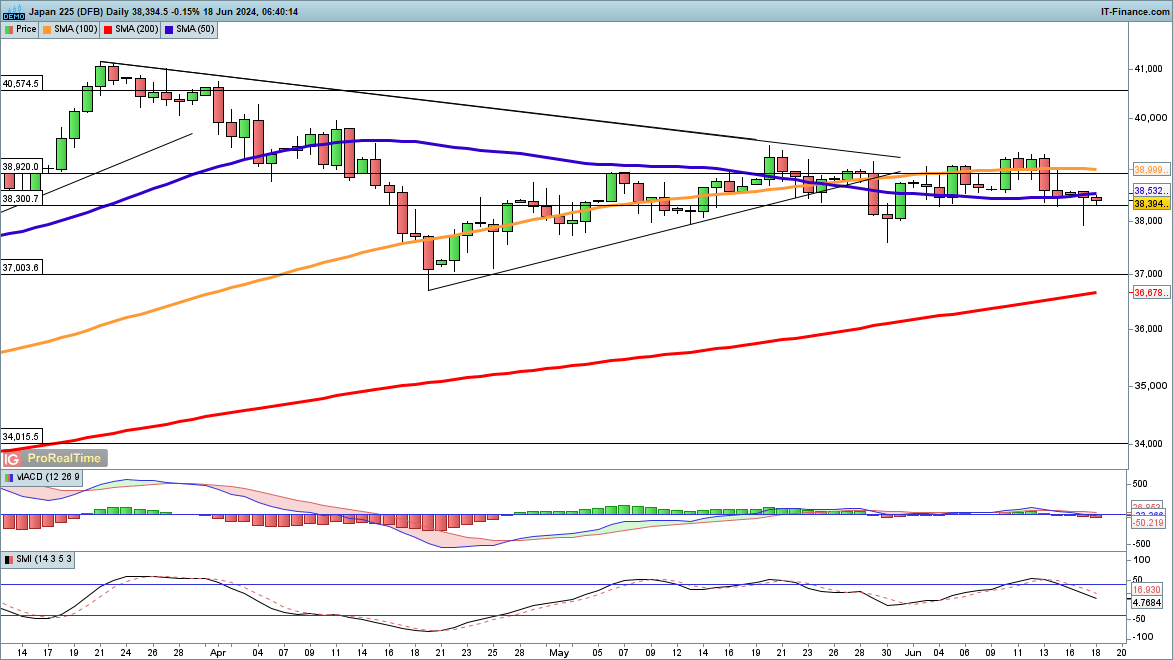
?The Nikkei 225 remains well off its recent highs, though Monday saw the index recover off the lows around 38,000. However, there has been little follow-on overnight, and the index has slipped back below the 50-day simple moving average (SMA). In the near term, any bounce will target last week’s highs around 39,000.
?A close below 38,000 could trigger a more bearish view, potentially opening the way to the April lows near 37,000.
Nikkei 225 Daily Chart
 |
"Simply a Must Read for Every Serious Forex Beginner" Available at Amazon Now also for Kindle
|