In this series we scale-back and take a look at the broader technical picture to gain a bit more perspective on where we are in trend. We looked at a few of these charts in today’sWeekly Strategy Webinar and heading into the start of the week, here are the key levels to consider.
EUR/USD Weekly
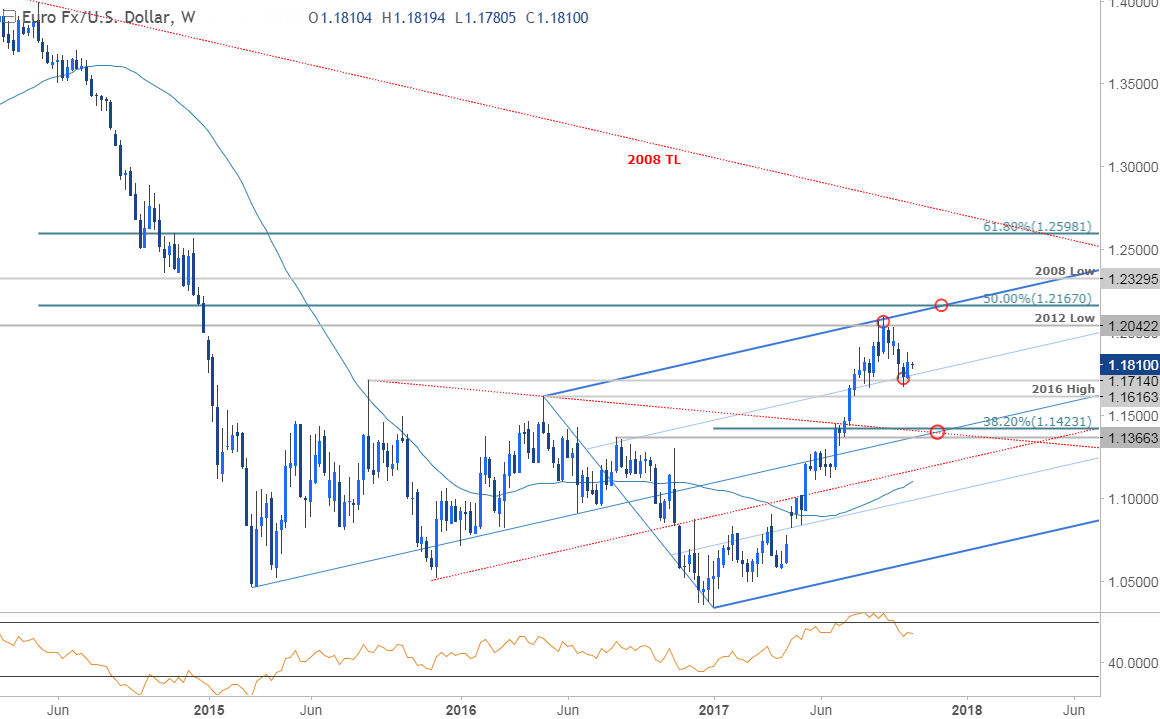
Notes:Euro turned from confluence resistancehighlighted last month at1.2042/80 with the pullback rebounding off the 50-line / August 2015 swing high at1.1714 last week. Things get a bit tricky from here – IF the pair is heading back towards the upper parallel at1.2167, price should stabilize above these lows. A break below1.1616 would suggest a larger correction is underway with such a scenario targeting key support & broader bullish invalidation at1.1366-1.1423.
Bottom line: The immediate focus is on a break of the monthly opening range (1.1670-1.1880) which has taken shape just above confluence support.
New to Forex? Get started with thisFree Beginners Guide
GBP/USD Weekly
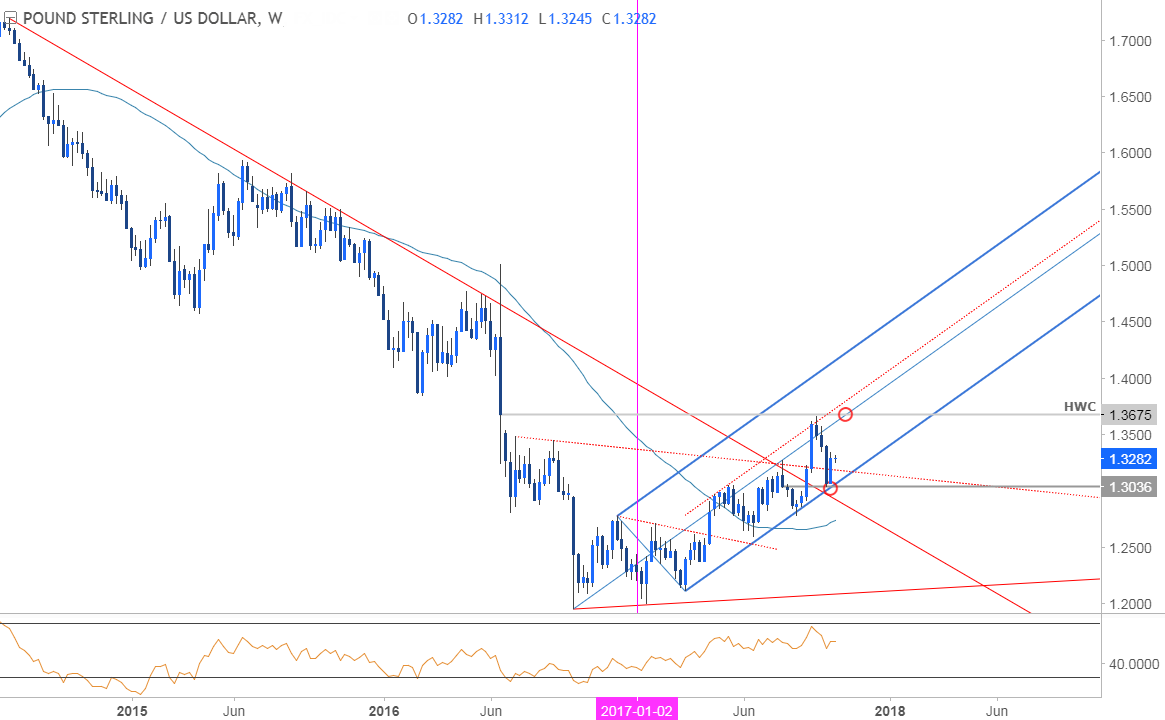
Notes: It’s been a wild ride in Cable with the pair reversing sharply off the 2016 high-week close at1.3675 (high registered at 1.3658) before rebounding off the lowermedian-line parallel last week.
Bottom line: The pair remains constructive while above the July high-week reversal close at1.3036. Look for a breach above the high-week close at1.3494 to validate resumption of the broader up-trend targeting1.3675 & the upper parallels.
See how shifts inGBP/USD retail positioning are impacting trend-Click here to learn more about sentiment!
USD/CADWeekly Chart
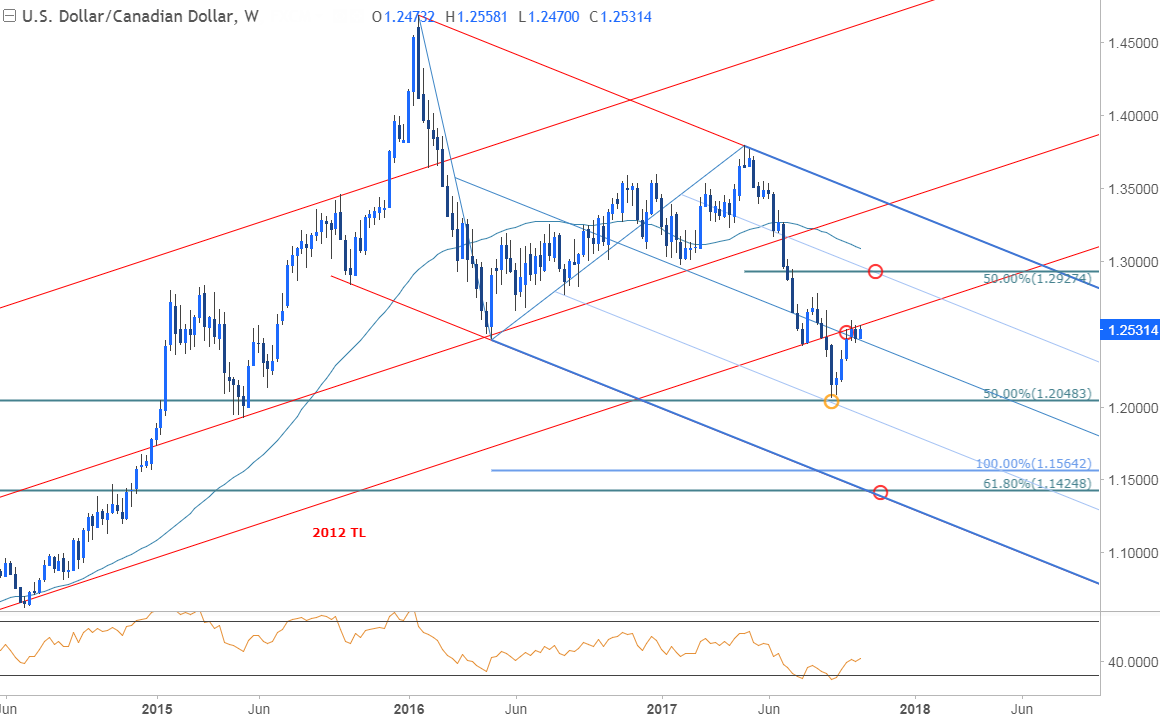
Notes:USDCAD turned just ahead of confluence support at1.2048 last month (low registered at 1.2061) with the rally now testing the 2012 trendline support as resistance. I’m inclined to look lower from here but a firm close below the median-line / monthly opening-range low at1.2433 would be needed to validate resumption of the broader downtrend.
Bottom line: IF the break below multi-year trendline support (red) was legit, price should hold these highs. A topside break risks a rally up towards the 50-line which converges on the 50% retracement of the yearly range at1.2927.
Check out ourQ4 USD/CAD projections in ourFree DailyFX Trading Forecasts
Previous Weekly Technical Perspectives
- Written by Michael Boutros, Currency Strategist with DailyFX
Follow Michaelon Twitter@MBForex contact him at This e-mail address is being protected from spambots. You need JavaScript enabled to view it orClick Here to be added to his email distribution list.
 |
"Simply a Must Read for Every Serious Forex Beginner" Available at Amazon Now also for Kindle
|
